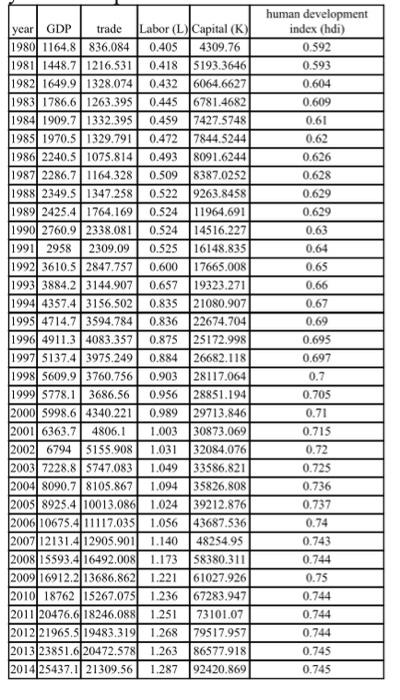
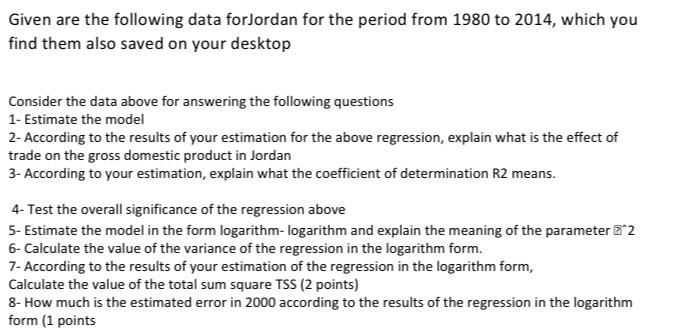
year GDP trade Labor (L) Capital (K) 1980 1164.8836.084 0.405 4309.76 1981 1448.7 1216.531 0.418 5193.3646 1982 1649.9 1328.074 0.432 6064.6627 1983 1786.61263.395 0.445 6781.4682 1984 1909.7 1332.395 0.459 7427.5748 1985 1970.5 1329.791 0.472 7844.5244 1986 2240.5 1075.814 0.493 8091.6244 1987 2286.71164.328 0.509 8387.0252 1988 2349.5 1347.258 0.522 9263.8458 1989 2425.4 1764.169 0.524 11964.691 1990 2760.92338.081 0.524 14516.227 1991| 2958 2309.09 0.525 16148.835 1992 3610.5 2847.757 0.600 17665.008 1993 3884.23144.907 0.657 19323.271 1994 4357.4 3156.502 0.835 21080.907 1995 4714.73594.784 0.836 22674.704 1996 4911.34083.357 0.875 25172.998 1997 5137.4 3975 249 0.884 26682.118 1998 5609.93760.756 0.903 28117.064 1999 5778.1 3686.56 0.956 28851.194 2000 5998.6 4340.221 0.989 29713.846 2001 6363.7 4806.1 1,003 30873.069 20021 6794 5155.908 1.031 32084.076 2003 7228.8 5747.083 1.049 33586.821 2004 8090.7 8105.867 1.094 35826.808 2005 8925.4 10013.086 1.024 39212.876 200610675.411117.035 1.056 43687.536 200712131412905.901 1.140 48254.95 2008 15593.416492.008 1.173 58380.311 200916912.2 13686.862 1.221 61027.926 2010 18762 15267.075 1.236 67283.947 2011 20476,618246.088 1.251 73101.07 201221965,519483.319 1.268 79517.957 2013 23851.6 20472.578 1.263 86577.918 2014 25437.1 21309.56 1.287 92420.869 human development index (hdi) 0.592 0.593 0.604 0.609 0.61 0.62 0.626 0.628 0.629 0.629 0.63 0.64 0.65 0.66 0.67 0.69 0.695 0.697 0.7 0.705 0.71 0.715 0.72 0.725 0.736 0.737 0.74 0.743 0.744 0.75 0.744 0.744 0.744 0.745 0.745 Given are the following data forJordan for the period from 1980 to 2014, which you find them also saved on your desktop Consider the data above for answering the following questions 1- Estimate the model 2- According to the results of your estimation for the above regression, explain what is the effect of trade on the gross domestic product in Jordan 3- According to your estimation, explain what the coefficient of determination R2 means. 4-Test the overall significance of the regression above 5- Estimate the model in the form logarithm-logarithm and explain the meaning of the parameter 2 6- Calculate the value of the variance of the regression in the logarithm form. 7- According to the results of your estimation of the regression in the logarithm form, Calculate the value of the total sum square TSS (2 points) 8- How much is the estimated error in 2000 according to the results of the regression in the logarithm form (1 points


