Answered step by step
Verified Expert Solution
Question
1 Approved Answer
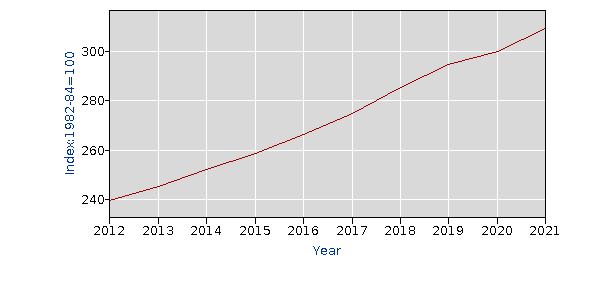
Year Jan Feb Mar Apr May Jun Jul Aug Sep Oct Nov Dec Annual HALF1 HALF2 2012 236.880 238.985 239.806 241.170 242.834 239.533 239.650 238.099
| Year | Jan | Feb | Mar | Apr | May | Jun | Jul | Aug | Sep | Oct | Nov | Dec | Annual | HALF1 | HALF2 |
| 2012 | 236.880 | 238.985 | 239.806 | 241.170 | 242.834 | 239.533 | 239.650 | 238.099 | 241.201 | ||||||
| 2013 | 242.677 | 244.675 | 245.935 | 246.072 | 246.617 | 245.711 | 245.023 | 243.894 | 246.152 | ||||||
| 2014 | 248.615 | 251.495 | 253.317 | 253.354 | 254.503 | 252.273 | 251.985 | 250.507 | 253.463 | ||||||
| 2015 | 254.910 | 257.622 | 259.117 | 259.917 | 261.019 | 260.289 | 258.572 | 256.723 | 260.421 | ||||||
| 2016 | 262.600 | 264.565 | 266.041 | 267.853 | 270.306 | 269.483 | 266.344 | 263.911 | 268.777 | ||||||
| 2017 | 271.626 | 274.589 | 275.304 | 275.893 | 277.570 | 277.414 | 274.924 | 273.306 | 276.542 | ||||||
| 2018 | 281.308 | 283.422 | 286.062 | 287.664 | 289.673 | 289.896 | 285.550 | 282.666 | 288.435 | ||||||
| 2019 | 291.227 | 294.801 | 295.259 | 295.490 | 298.443 | 297.007 | 295.004 | 293.150 | 296.859 | ||||||
| 2020 | 299.690 | 298.074 | 300.032 | 300.182 | 301.736 | 302.948 | 300.084 | 299.109 | 301.059 | ||||||
| 2021 | 304.387 | 309.419 | 309.497 | 311.167 | 313.265 | 315.805 | 309.721 | 306.724 | 312.718 | ||||||
| 2022 | 320.195 | 324.878 | 330.539 | 323.408 |
 please look at the data and chart, and provide appropriate analysis for them which have to be 5 lines at least
Step by Step Solution
There are 3 Steps involved in it
Step: 1

Get Instant Access to Expert-Tailored Solutions
See step-by-step solutions with expert insights and AI powered tools for academic success
Step: 2

Step: 3

Ace Your Homework with AI
Get the answers you need in no time with our AI-driven, step-by-step assistance
Get Started


