

Answered step by step
Verified Expert Solution
Question
1 Approved Answer
Year NYSE Stock X - 26,5% 1 2 37.2 3 - 11.0% 25.0 11.0 6.0 23.8 -7.2 4 5 6.6 7.1 6 18.6 20.5 30.6
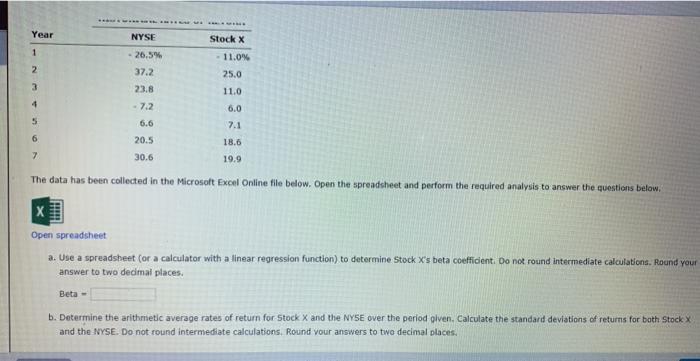
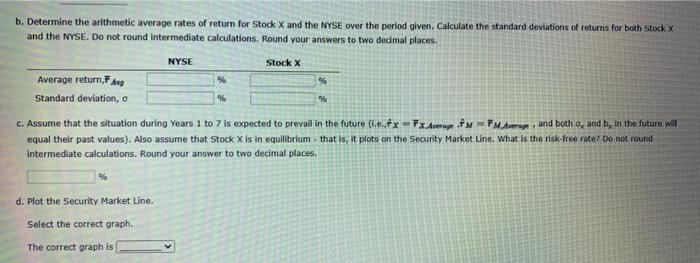
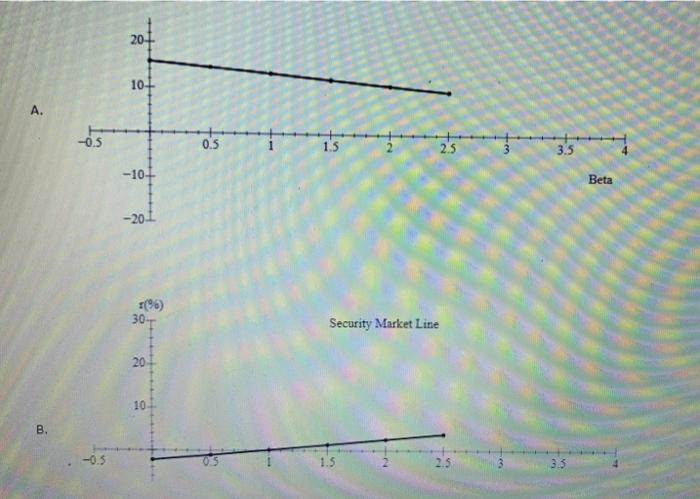
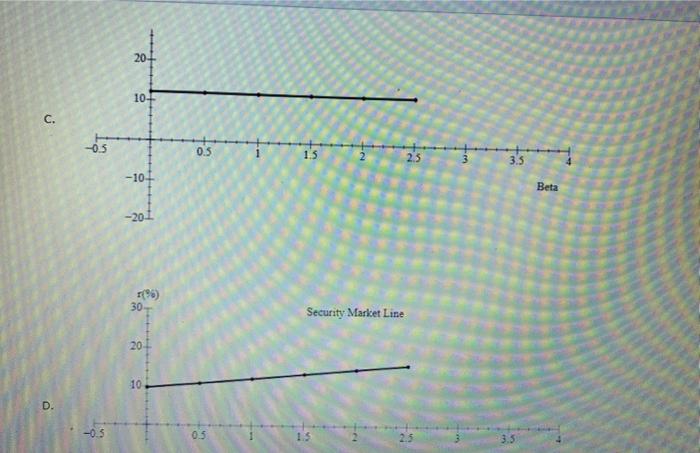
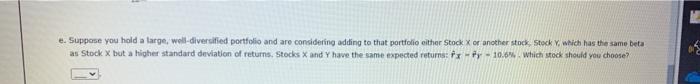 Year NYSE Stock X - 26,5% 1 2 37.2 3 - 11.0% 25.0 11.0 6.0 23.8 -7.2 4 5 6.6 7.1 6 18.6 20.5 30.6 7 19.9 The data has been collected in the Microsoft Excel Online file below. Open the spreadsheet and perform the required analysis to answer the questions below. Open spreadsheet a. Use a spreadsheet (or a calculator with a linear regression function) to determine Stock X's beta coefficient. Do not round intermediate calculations. Round your answer to two dedmal places. Beta- b. Determine the arithmetic average rates of return for Stock X and the NYSE over the period olven. Calculate the standard deviations of returns for both Stock and the NYSE. Do not found intermediate calculations, Round your answers to two decimal places. Stock X % b. Determine the arithmetic average rates of return for Stock X and the NYSE over the period given. Calculate the standard deviations of returns for both Stock and the NYSE. Do not round intermediate calculations, Round your answers to two decimal places NYSE Average return, Flug Standard deviation, o C. Assume that the situation during Years 1 to 7 is expected to prevail in the future (.e.fx=Fx Average of m=FMArriage, and both o, and b, in the future will equal their past values). Also assume that Stock X is in equilibrium - that is, it plots on the Security Market Line. What is the risk-free rate? Do not round intermediate calculations. Round your answer to two decimal places. 96 % % d. Plot the Security Market Line. Select the correct graph. The correct graph is 20 10+ A. -0.5 0.5 1.5 w+ 3.5 -10 Beta - 20.1 (96) 30 Security Market Line 20 10 B. -0.5 1.5 3.3 20. 10-1 C. -0.5 0.5 i 15 2.5 3.5 -10+ Beta 20 (9) 30 Security Market Line 20 10 D. -0.5 03 1.5 3.5 e. Suppose you hold a large, well-diversified portfolio and are considering adding to that portfolio either Stock X or another stock, Stock , which has the same beta as Stock x but a higher standard deviation of returns. Stocks X and Y have the same expected returns: px - y - 10.6%. Which stock should you choose
Step by Step Solution
There are 3 Steps involved in it
Step: 1

Get Instant Access to Expert-Tailored Solutions
See step-by-step solutions with expert insights and AI powered tools for academic success
Step: 2

Step: 3
Ace Your Homework with AI
Get the answers you need in no time with our AI-driven, step-by-step assistance
Get Started
Chains Of Finance How Investment Management Is Shaped
Authors: Diane-Laure Arjalies, Philip Grant, Iain Hardie, Donald MacKenzie, Ekaterina Svetlova
1st Edition
0198802943, 978-0198802945