Answered step by step
Verified Expert Solution
Link Copied!

Question

1 Approved Answer

Year Quarter | Sales 1 1 4 1 2 2 1 3 3 1 4 5 2 1 6 2 2 3 2 3 5
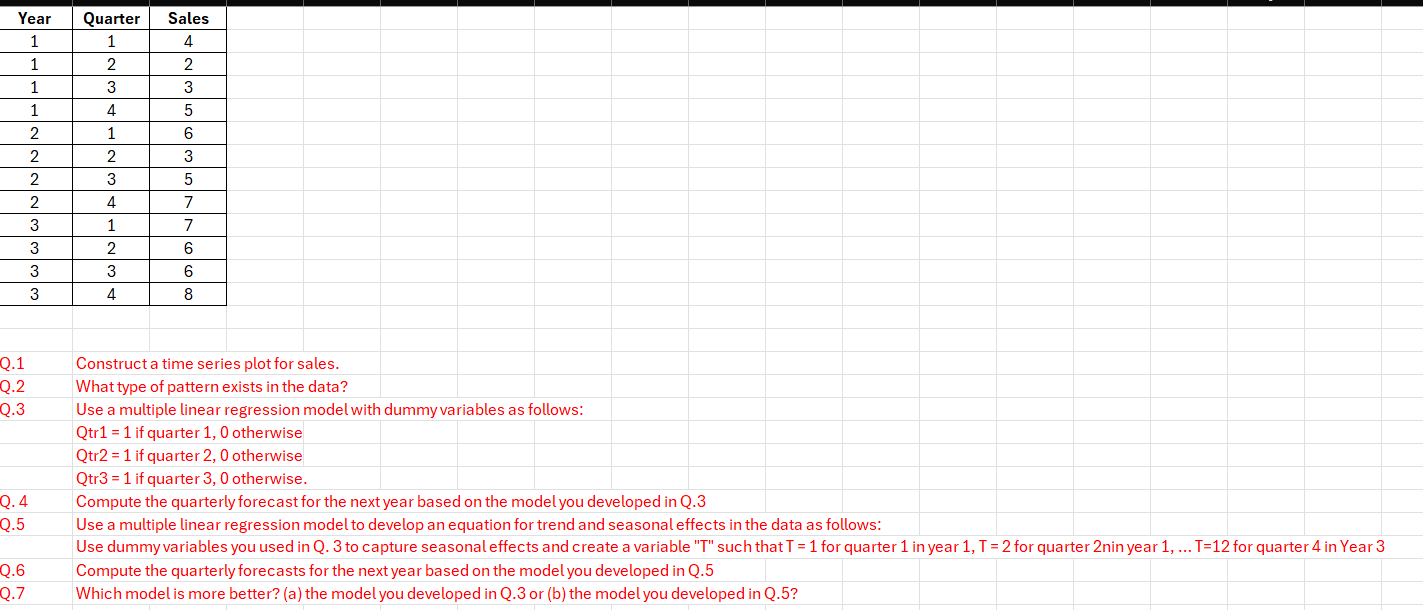
image text in transcribed
Year Quarter | Sales 1 1 4 1 2 2 1 3 3 1 4 5 2 1 6 2 2 3 2 3 5 2 4 7 3 1 7 3 2 6 3 3 6 3 4 8 Q.1 Construct a time series plot for sales. Q.2 What type of pattern exists in the data? Q.3 Use a multiple linear regression model with dummy variables as follows: Qtrl =1if quarter 1, 0 otherwise Qtr2 =1if quarter 2, 0 otherwise Qtr3 = 1if quarter 3, 0 otherwise. Q.4 Compute the quarterly forecast for the next year based on the model you developed in Q.3 Q.5 Use a multiple linear regression model to develop an equation for trend and seasonal effects in the data as follows: Use dummyvariables you used in (. 3 to capture seasonal effects and create a variable "T" such that T =1 for quarter 1 inyear 1, T=2 for quarter 2ninyear 1, ... T=12 for quarter 4 in Year 3 Q.6 Compute the quarterly forecasts for the next year based on the model you developed in Q.5 Q.7 Which modelis more better? (a) the model you developed in Q.3 or (b) the modelyou developed in Q.57

Step by Step Solution

There are 3 Steps involved in it

Step: 1

blur-text-image

Get Instant Access to Expert-Tailored Solutions

See step-by-step solutions with expert insights and AI powered tools for academic success

Step: 2

blur-text-image

Step: 3

blur-text-image

Ace Your Homework with AI

Get the answers you need in no time with our AI-driven, step-by-step assistance

Get Started

Recommended Textbook for

A Survey of Mathematics with Applications

Authors: Allen R. Angel, Christine D. Abbott, Dennis Runde

10th edition

134112105, 134112342, 9780134112343, 9780134112268, 134112261, 978-0134112107

More Books

Students also viewed these Mathematics questions

Question

\f

Answered: 1 week ago