Answered step by step
Verified Expert Solution
Link Copied!

Question

1 Approved Answer

Year Total Number of Stores 1992 127 1993 183 1994 300 1995 483 1996 746 1997 1121 1998 1568 1999 2028 2000 2674 2001 3817
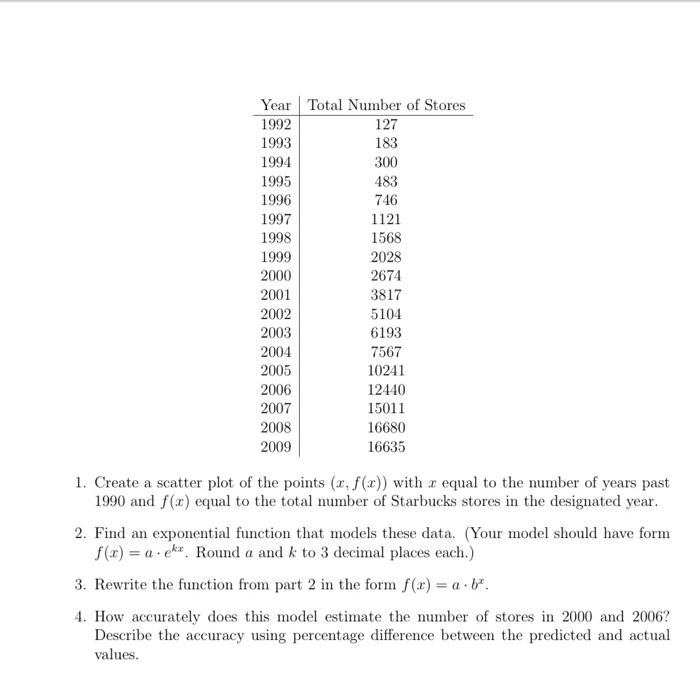
image text in transcribed
Year Total Number of Stores 1992 127 1993 183 1994 300 1995 483 1996 746 1997 1121 1998 1568 1999 2028 2000 2674 2001 3817 2002 5104 2003 6193 2004 7567 2005 10241 2006 12440 2007 15011 2008 16680 2009 16635 1. Create a scatter plot of the points (1,f(x) with x equal to the number of years past 1990 and f(x) equal to the total number of Starbucks stores in the designated year. 2. Find an exponential function that models these data. (Your model should have form f(x) = a. pkt. Round a and k to 3 decimal places each.) 3. Rewrite the function from part 2 in the form f(x)= a.b". 4. How accurately does this model estimate the number of stores in 2000 and 2006? Describe the accuracy using percentage difference between the predicted and actual values

Step by Step Solution

There are 3 Steps involved in it

Step: 1

blur-text-image

Get Instant Access to Expert-Tailored Solutions

See step-by-step solutions with expert insights and AI powered tools for academic success

Step: 2

blur-text-image

Step: 3

blur-text-image

Ace Your Homework with AI

Get the answers you need in no time with our AI-driven, step-by-step assistance

Get Started

Recommended Textbook for

More Books

Students also viewed these Finance questions