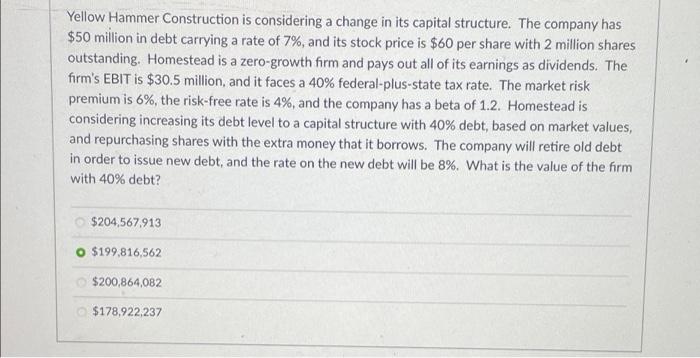
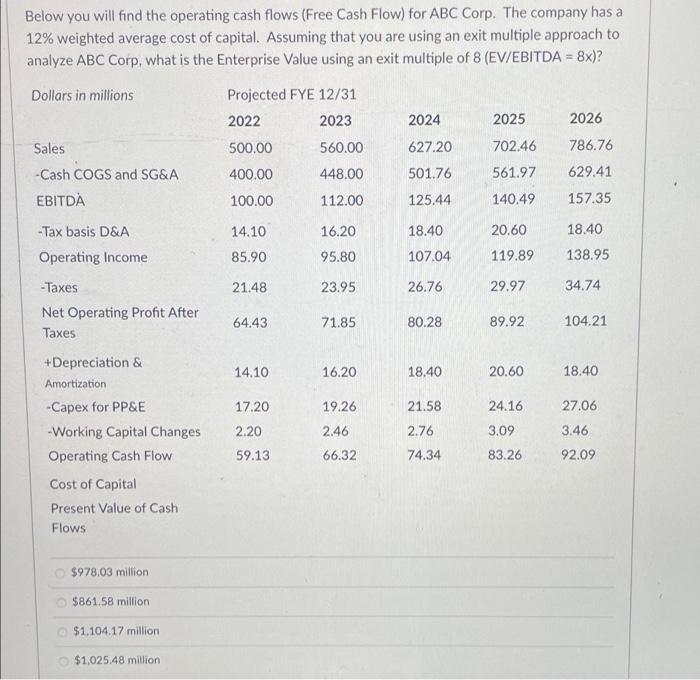
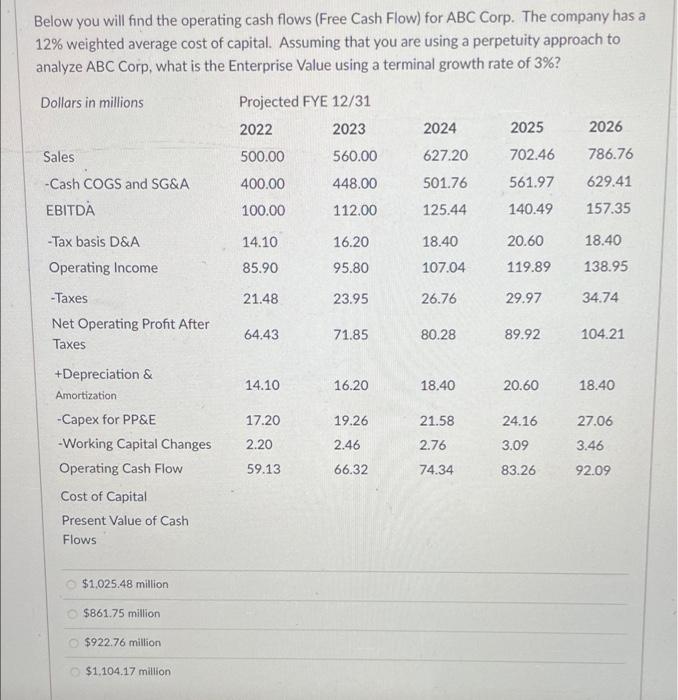
Yellow Hammer Construction is considering a change in its capital structure. The company has $50 million in debt carrying a rate of 7%, and its stock price is $60 per share with 2 million shares outstanding. Homestead is a zero-growth firm and pays out all of its earnings as dividends. The firm's EBIT is $30.5 million, and it faces a 40% federal-plus-state tax rate. The market risk premium is 6%, the risk-free rate is 4%, and the company has a beta of 1.2. Homestead is considering increasing its debt level to a capital structure with 40% debt, based on market values, and repurchasing shares with the extra money that it borrows. The company will retire old debt in order to issue new debt, and the rate on the new debt will be 8%. What is the value of the form with 40% debt? $204,567.913 $199,816,562 $200,864,082 $178,922,237 Below you will find the operating cash flows (Free Cash Flow) for ABC Corp. The company has a 12% weighted average cost of capital. Assuming that you are using an exit multiple approach to analyze ABC Corp, what is the Enterprise Value using an exit multiple of 8 (EV/EBITDA = 8x)? Dollars in millions Projected FYE 12/31 2022 2023 2024 2025 2026 Sales 500.00 560.00 627.20 702.46 786.76 -Cash COGS and SG&A 400.00 448.00 501.76 561.97 629.41 EBITDA 100.00 112.00 125.44 140.49 157.35 -Tax basis D&A 14.10 16.20 18.40 20.60 18.40 Operating Income 85.90 95.80 107.04 119.89 138.95 -Taxes 21.48 23.95 26.76 29.97 34.74 Net Operating Profit After 64.43 71.85 80.28 89.92 104.21 Taxes 14.10 16.20 18.40 20.60 18.40 +Depreciation & Amortization -Capex for PP&E -Working Capital Changes Operating Cash Flow 17.20 19.26 21.58 27.06 3.46 2.20 2.46 24.16 3.09 83.26 2.76 59.13 66.32 74.34 92.09 Cost of Capital Present Value of Cash Flows $978.03 million $861.58 million $1.104.17 million $1,025.48 million Below you will find the operating cash flows (Free Cash Flow) for ABC Corp. The company has a 12% weighted average cost of capital. Assuming that you are using a perpetuity approach to analyze ABC Corp, what is the Enterprise Value using a terminal growth rate of 3%? Dollars in millions 2024 2025 2026 Projected FYE 12/31 2022 2023 500.00 560.00 400.00 448.00 627.20 702.46 786.76 Sales -Cash COGS and SG&A EBITDA 501.76 561.97 629.41 100.00 112.00 125.44 140.49 157.35 - Tax basis D&A 14.10 20.60 18.40 16.20 95.80 18.40 107.04 Operating Income 85.90 119.89 138.95 21.48 23.95 26.76 29.97 34.74 -Taxes Net Operating Profit After Taxes 64.43 71.85 80.28 89.92 104.21 14.10 16.20 18.40 20.60 18.40 19.26 24.16 27.06 17.20 2.20 21.58 2.76 2.46 3.09 3.46 +Depreciation & Amortization -Capex for PP&E -Working Capital Changes Operating Cash Flow Cost of Capital Present Value of Cash Flows 59.13 66.32 74.34 83.26 92.09 $1.025.48 million $861.75 million $922.76 million $1.104.17 million


