Answered step by step
Verified Expert Solution
Link Copied!

Question

1 Approved Answer

Yi(Sales) Forecast 4.8 4.89 4.1 4.52 6.05 6.5 6.53 5.8 5.44 S.2 5.01 6.8 6.69 7.4 98 63 5,99 SUMMARY OUTPUT Regression Sentidics Multiple R
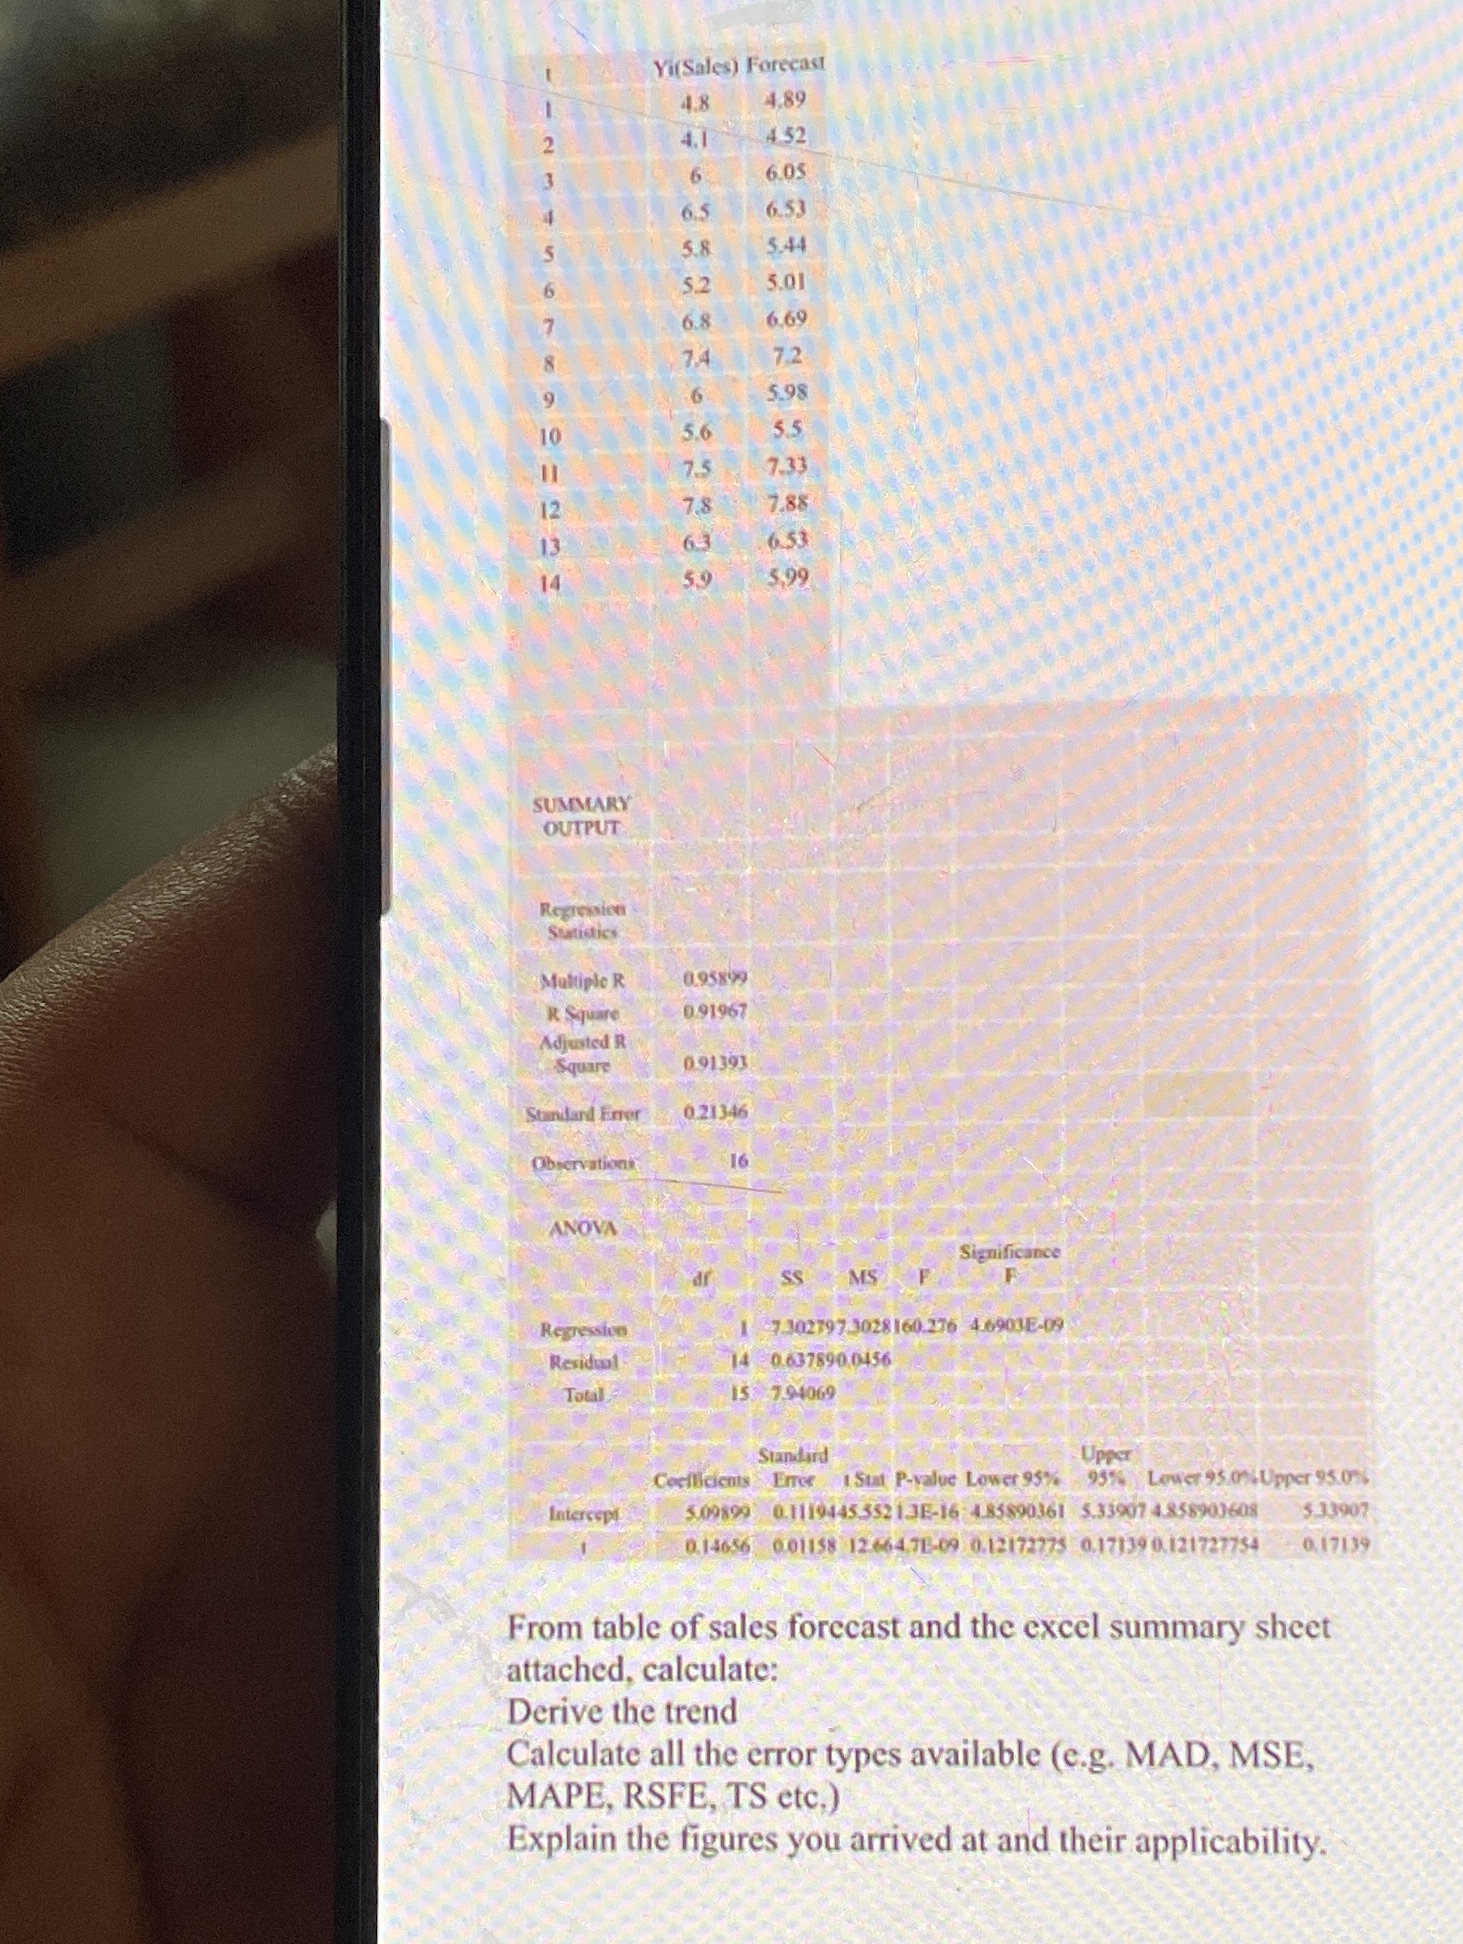
image text in transcribed
Yi(Sales) Forecast 4.8 4.89 4.1 4.52 6.05 6.5 6.53 5.8 5.44 S.2 5.01 6.8 6.69 7.4 98 63 5,99 SUMMARY OUTPUT Regression Sentidics Multiple R 0.95899 R Square 091967 Adjusted R Square 0.91393 Standard Ener 0.21346 Observations 16 ANOVA Significance SS MS Regression 7.302797 3028 160.276 4.6903E-09 Residual 14 0.637890.0456 Total 15 794069 Standard Coefficients Error Stat P-value Lower 95%% 93%% Lower 95.0%, Upper 95.07 Intercept 5.09899 0.1119445.3521.3E-16 4.85890361 5.33907 4.858903608 5.33907 0.14656 0.01158 12 664 7E-09 0.12172775 0.17139 0.121727734 0.17139 From table of sales forecast and the excel summary sheet attached, calculate: Derive the trend Calculate all the error types available (e.g. MAD, MSE, MAPE, RSFE, TS etc.) Explain the figures you arrived at and their applicability

Step by Step Solution

There are 3 Steps involved in it

Step: 1

blur-text-image

Get Instant Access to Expert-Tailored Solutions

See step-by-step solutions with expert insights and AI powered tools for academic success

Step: 2

blur-text-image

Step: 3

blur-text-image

Ace Your Homework with AI

Get the answers you need in no time with our AI-driven, step-by-step assistance

Get Started

Recommended Textbook for

Ethics Theory and Contemporary Issues

Authors: Barbara MacKinnon, Andrew Fiala

8th edition

9781305162846, 1285196759, 1305162846, 978-1285196756

More Books

Students also viewed these General Management questions