

Question
You are a financial analyst at a firm that has been returning cash to shareholders through stock repurchases. You want to determine how the level
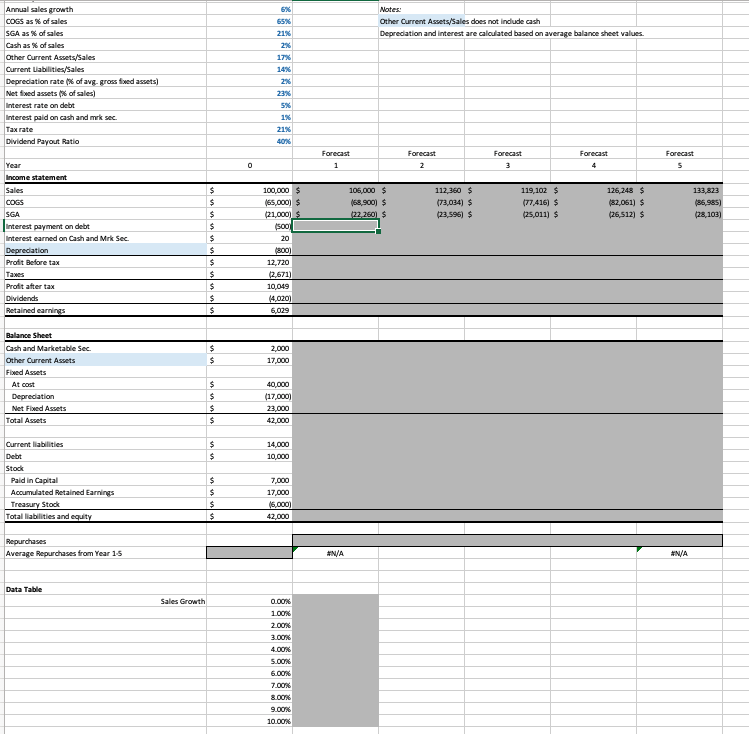
You are a financial analyst at a firm that has been returning cash to shareholders through stock repurchases. You want to determine how the level of repurchases will vary as a function of the sales growth the firm achieves over the next 5 years. To do so, build out a pro-forma of the firm reflecting the assumptions noted in the template spreadsheet. Assume the debt balance will remain constant.
1. (25 points) Complete the five-year forecasted pro-forma financial statement for the firm. Please assume that any excess cash will go to repurchases, so use Treasury Stock as the plug in the model. What is the average level of repurchases over the five-year period that the firm can manage based on the assumed sales growth rate?
2. (10 points) You want to forecast the levels of repurchases if sales growth differs from your baseline assumption. To determine this, create an Excel data table that shows the amount of average repurchases over the five-year period as a function of the sales growth rate. Consider sales growth ranging from 0% to 10% in increments of 1%. At approximately what sales growth rate is the firm unable to sustain average repurchases of at least $5,500 (on average over the next 5 years)?
Step by Step Solution
There are 3 Steps involved in it
Step: 1

Get Instant Access to Expert-Tailored Solutions
See step-by-step solutions with expert insights and AI powered tools for academic success
Step: 2

Step: 3
Ace Your Homework with AI
Get the answers you need in no time with our AI-driven, step-by-step assistance
Get Started
Law And Order Review 1993 An Audit Of Crime Policing And Criminal Justice Issues
Authors: John Benyon
1st Edition
1874493901, 978-1874493907