You are a financial analyst with Moore Components Parts Inc. (MCP). All of the MCPs sales are on credit. One part of your job is
You are a financial analyst with Moore Components Parts Inc. (MCP). All of the MCPs sales are on credit. One part of your job is to analyze prospective customers and to approve or decline them for sales on credit. The typical terms of your companys credit sales require payment within 30 days of delivery. Your boss, Ms. Kelley has asked you to review the financial statements of a prospective customer, the Alpha Beta Computer Company (ABC). In this role, the focus of your analysis is on the customers ability to pay their invoices on time and in full. (Refer to the ABC financial statements.) When analyzing ABC, you notice that inventory turnover is lower than in prior years. Provide three explanations that would be consistent with this observation. Explain whether these changes are of concern to you and what the effect might be, if any, on MCPs ability to collect on credit sales in a timely manner and in accordance with agreed terms. You also notice that accounts receivable turnover this year is lower than in prior years. Please provide three explanations that would be consistent with this observation. Explain whether these would be of concern to you.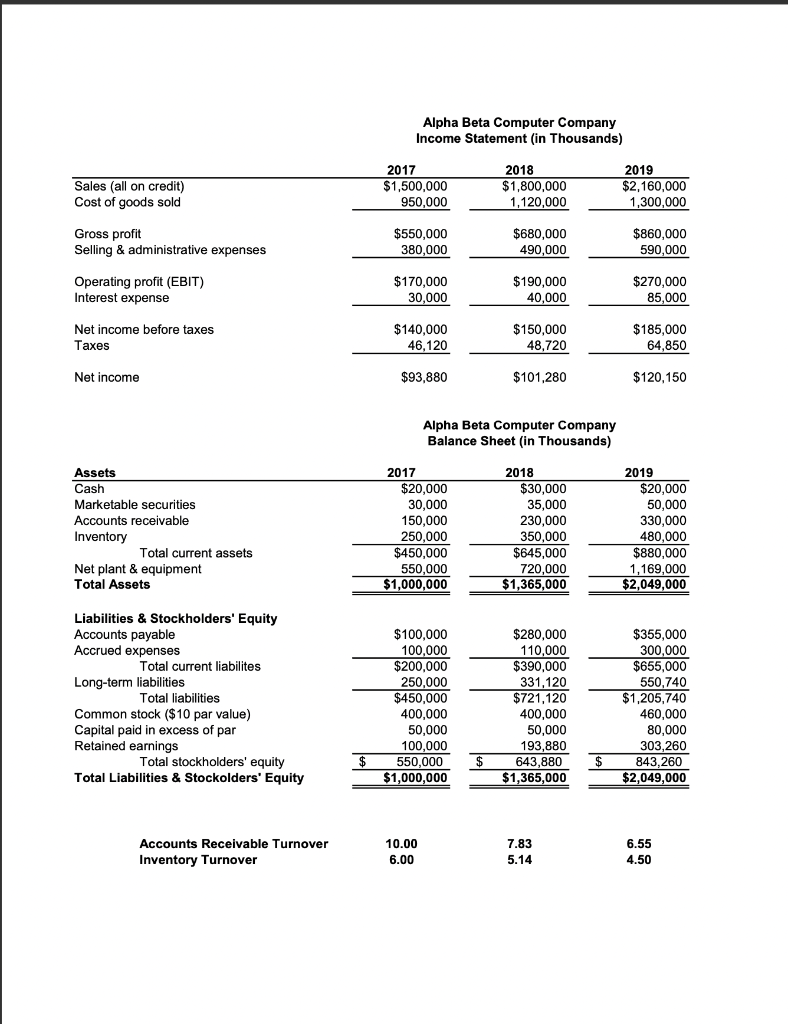
Sales (all on credit) Cost of goods sold Gross profit Selling & administrative expenses Operating profit (EBIT) Interest expense Net income before taxes Taxes Net income Assets Cash Marketable securities Accounts receivable Inventory Total current assets Net plant & equipment Total Assets Liabilities & Stockholders' Equity Accounts payable Accrued expenses Total current liabilites Long-term liabilities Total liabilities Common stock ($10 par value) Capital paid in excess of par Retained earnings Total stockholders' equity Total Liabilities & Stockolders' Equity Accounts Receivable Turnover Inventory Turnover $ Alpha Beta Computer Company Income Statement (in Thousands) 2018 $1,800,000 1,120,000 $680,000 490,000 $190,000 40,000 $150,000 48,720 $101,280 Alpha Beta Computer Company Balance Sheet (in Thousands) 2018 $30,000 35,000 230,000 350,000 $645,000 720,000 $1,365,000 $280,000 110,000 $390,000 331,120 $721,120 121,12 400,000 50,000 193,880 643,880 $1,365,000 7.83 5.14 2017 $1,500,000 950,000 $550,000 380,000 $170,000 30,000 $140,000 46,120 $93,880 2017 $20,000 30,000 150,000 250,000 $450,000 550,000 $1,000,000 $100,000 100,000 $200,000 250,000 500.000 $450,000 400,000 50,000 100,000 550,000 $1,000,000 10.00 6.00 $ $ 2019 $2,160,000 1,300,000 $860,000 590,000 $270,000 85,000 $185.000 64,850 $120,150 2019 $20,000 50,000 330,000 480,000 $880,000 1,169,000 $2,049,000 $355,000 300,000 $655,000 550,740 30,740 $1,205,740 209,140 460,000 80,000 303,260 843,260 $2,049,000 6.55 4.50 Sales (all on credit) Cost of goods sold Gross profit Selling & administrative expenses Operating profit (EBIT) Interest expense Net income before taxes Taxes Net income Assets Cash Marketable securities Accounts receivable Inventory Total current assets Net plant & equipment Total Assets Liabilities & Stockholders' Equity Accounts payable Accrued expenses Total current liabilites Long-term liabilities Total liabilities Common stock ($10 par value) Capital paid in excess of par Retained earnings Total stockholders' equity Total Liabilities & Stockolders' Equity Accounts Receivable Turnover Inventory Turnover $ Alpha Beta Computer Company Income Statement (in Thousands) 2018 $1,800,000 1,120,000 $680,000 490,000 $190,000 40,000 $150,000 48,720 $101,280 Alpha Beta Computer Company Balance Sheet (in Thousands) 2018 $30,000 35,000 230,000 350,000 $645,000 720,000 $1,365,000 $280,000 110,000 $390,000 331,120 $721,120 121,12 400,000 50,000 193,880 643,880 $1,365,000 7.83 5.14 2017 $1,500,000 950,000 $550,000 380,000 $170,000 30,000 $140,000 46,120 $93,880 2017 $20,000 30,000 150,000 250,000 $450,000 550,000 $1,000,000 $100,000 100,000 $200,000 250,000 500.000 $450,000 400,000 50,000 100,000 550,000 $1,000,000 10.00 6.00 $ $ 2019 $2,160,000 1,300,000 $860,000 590,000 $270,000 85,000 $185.000 64,850 $120,150 2019 $20,000 50,000 330,000 480,000 $880,000 1,169,000 $2,049,000 $355,000 300,000 $655,000 550,740 30,740 $1,205,740 209,140 460,000 80,000 303,260 843,260 $2,049,000 6.55 4.50