Question
You are a junior data analyst for a property investment firm. A dataset assign2_data.csv is provided to you (please note the csv standards for comma
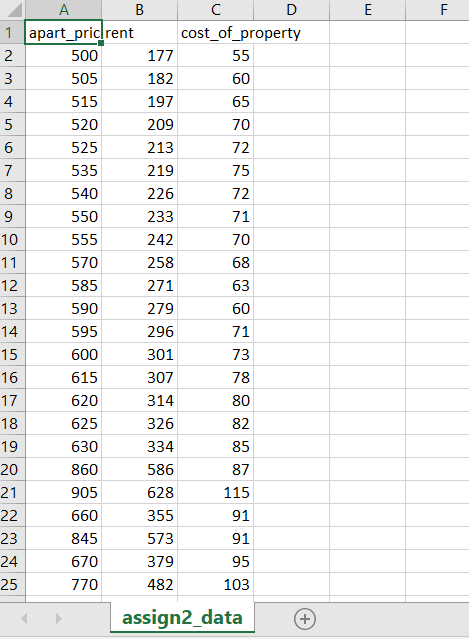
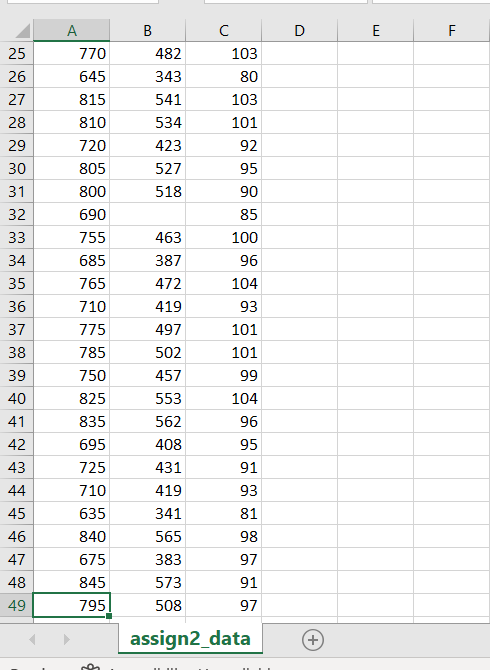
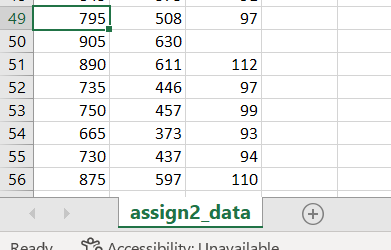
You are a junior data analyst for a property investment firm. A dataset assign2_data.csv is provided to you (please note the csv standards for comma separated values file which is nothing but just a text file), and your job is to perform some initial data processing task so that the provided dataset can be used later for further analysis. The dataset contains 3 columns and 56 rows (including the header row). The three columns are apart_price (which represents prices, in thousands dollars, for 55 one bedroom apartments in city X), rent (which represents the rent per week, in dollars, for the corresponding one bedroom apartment), and cost_of_property (which represents the associated costs, in dollars, to hold the corresponding property). Each row holds the aforementioned information for a particular one bedroom apartment.
Please complete the following steps:
1. Data Loading
1). Load the provided dataset with pandas as Dataframe 2). Name your Dataframe as df
2. Handle Missing Values
1). Check if there is any missing values
2). Remove any missing values if there is one
3. Handle Duplicates
1). Check if there is any duplicates
2). Remove any duplicates if there is one
3). If you remove any duplicates, reset your row index (so that the new dataset will
exclude index for duplicates)
4). Name the resulting Dataframe as df_clean
Now, let us add a column (which has only zeros and ones where 1 represents the bedroom is available to rent out and 0 otherwise) to df_clean.
4. Create and Add the Column
1). Create a single column Dataframe called df_status with all entries equal to zero and
has status as its column name
2). Set the 1st, 7th, 22nd, 35th, 47th elements equal to one
Note: Python index starts from 0, here, all index numbers match the actual Python index; for example, the 1st element should be the second entry in the Dataframe
3). Concatenate df_clean and df_status to form a new Dataframe and name it df_data
5. Draw Scatter Plots
1). Create an empty figure with two subplots
2). In the case status = 0, draw a scatter plot: apart_price vs rent on the first subplot,
add the title (Price vs Rent), x label (Rent) and y label (Price)
3). In the case status = 0, draw a scatter plot: apart_price vs cost_of_property on the
second plot, add the title (Price vs Cost), x label (Cost) and y label (Price)
6. Export the the figure in Step 8 with the format .jpg


E F 3 6 68 A B D 1 apart_pric! rent cost_of_property 2. 500 177 55 3 505 182 60 4. 515 197 65 5 520 209 70 6 525 213 72 7 535 219 75 8 540 226 72 9 550 233 71 10 555 242 70 11 570 258 12 585 271 63 13 590 279 60 14 595 296 71 600 301 615 307 78 17 620 314 80 18 625 326 82 19 630 334 85 20 860 586 87 21 905 628 115 660 355 91 23 845 573 91 24 670 379 95 770 482 103 73 15 16 22 25 assign2_data + B D E F 103 25 26 80 27 28 29 482 343 541 534 423 527 518 30 31 32 33 34 35 A 770 645 815 810 720 805 800 690 755 685 765 710 775 785 750 825 835 695 725 710 635 840 675 845 795 36 103 101 92 95 90 85 100 96 104 93 101 101 99 104 96 37 463 387 472 419 497 502 457 553 562 408 431 419 341 565 383 573 508 38 39 40 41 42 43 44 45 46 47 48 49 95 91 93 81 98 97 91 97 assign2_data + 49 50 51 52 53 54 55 56 795 905 890 735 750 665 730 875 508 97 630 611 112 446 97 457 99 373 93 437 94 597 110 assign2_data + Ready Accessibility. Inavailable E F 3 6 68 A B D 1 apart_pric! rent cost_of_property 2. 500 177 55 3 505 182 60 4. 515 197 65 5 520 209 70 6 525 213 72 7 535 219 75 8 540 226 72 9 550 233 71 10 555 242 70 11 570 258 12 585 271 63 13 590 279 60 14 595 296 71 600 301 615 307 78 17 620 314 80 18 625 326 82 19 630 334 85 20 860 586 87 21 905 628 115 660 355 91 23 845 573 91 24 670 379 95 770 482 103 73 15 16 22 25 assign2_data + B D E F 103 25 26 80 27 28 29 482 343 541 534 423 527 518 30 31 32 33 34 35 A 770 645 815 810 720 805 800 690 755 685 765 710 775 785 750 825 835 695 725 710 635 840 675 845 795 36 103 101 92 95 90 85 100 96 104 93 101 101 99 104 96 37 463 387 472 419 497 502 457 553 562 408 431 419 341 565 383 573 508 38 39 40 41 42 43 44 45 46 47 48 49 95 91 93 81 98 97 91 97 assign2_data + 49 50 51 52 53 54 55 56 795 905 890 735 750 665 730 875 508 97 630 611 112 446 97 457 99 373 93 437 94 597 110 assign2_data + Ready Accessibility. Inavailable
Step by Step Solution
There are 3 Steps involved in it
Step: 1

Get Instant Access to Expert-Tailored Solutions
See step-by-step solutions with expert insights and AI powered tools for academic success
Step: 2

Step: 3

Ace Your Homework with AI
Get the answers you need in no time with our AI-driven, step-by-step assistance
Get Started


