You are a marketing manager who needs provide a summary of the marketing trends from the data shared (3 files). Based on the marketing data attached, which highlights the growth of the business, what do you see from a marketing perspective:
- What area is the company showing increases in revenue? Declines in revenue by each business category
- Trends in terms of revenue or type and/or category of business
- Information and insights to help formulate marketing strategies to either continue growth or reverse decline
- Additional analysis to build a marketing goal and strategy or strategies.
- Why are you recommending the marketing strategy from question #4?
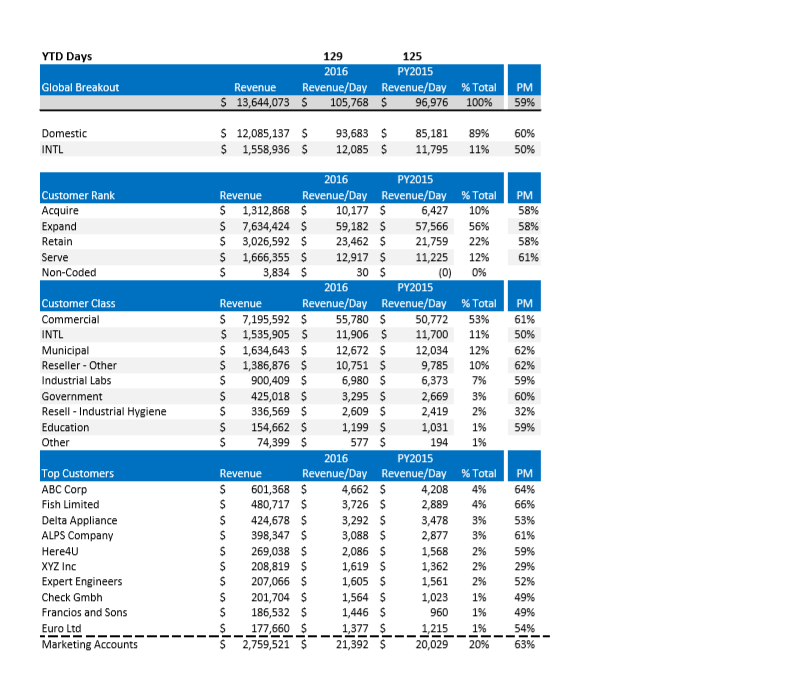
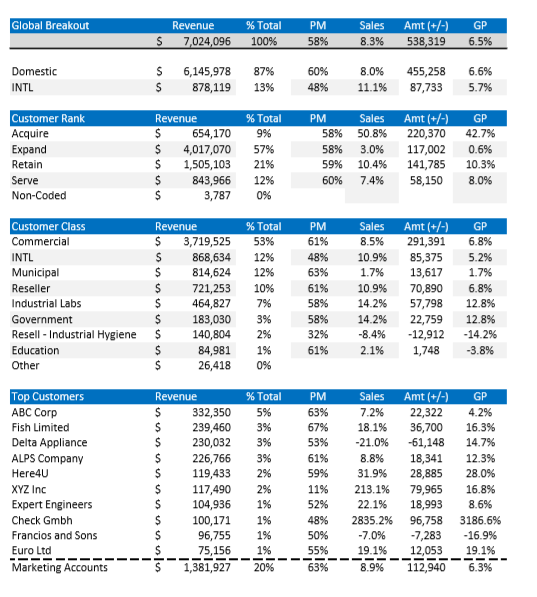
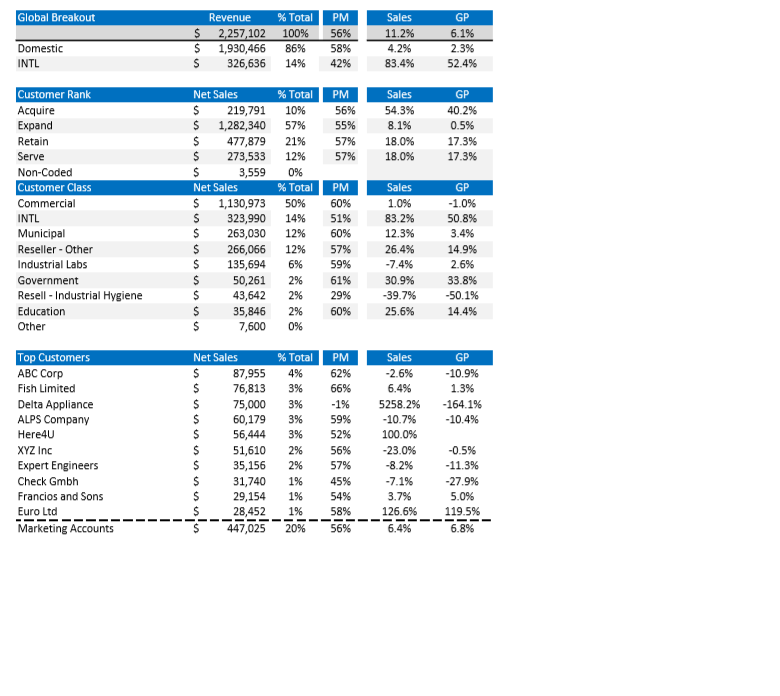
YTD Days 129 125 016 PY2015 Global Breakout Revenue Revenue/Day Revenue/Day % Total PM 5 13,644,073 S 105,768 5 96.976 100% 59% Domestic $ 12,085,137 5 93,683 85,181 89% 60% INTL 1,558,936 S 12,085 11,795 11% 50% 2016 PY2015 Customer Rank Revenue Revenue/Day Revenue/Day % Total PM Acquire 1,312,868 10,177 6,427 10% 58% Expand 7,634,424 59,182 57,566 56% 58% Retain 3,026,592 23,462 21,759 22% 18% Serve 1,666,355 12,917 S 11,225 12% 61% Non-Coded 3,834 30 0) 0% 2016 PY2015 Customer Class Revenue Revenue/Day Revenue/Day % Total PM Commercial 7,195,592 55,780 50,772 53% 61% NTL 1,535,905 11,906 11,700 11% 50% Municipal 1,634,643 12,672 12,034 12% 62% Reseller - Other 1,386,876 10,751 9,785 10% 62% Industrial Labs 900,409 6,980 6,373 7% 59% Government 425,018 3,295 2,669 3% 60% Resell - Industrial Hygiene 336,569 2,609 2,419 2% 32% Education 154,662 1,199 S 1,031 1% 59% Other 74,399 S 194 1% 2016 PY2015 Top Customers Revenue Revenue/Day Revenue/Day % Total PM ABC Corp 601,368 4,662 4,208 64% Fish Limited 480,717 3,726 2,889 4% 66% Delta Appliance 424,678 3,292 3,478 3% 53% ALPS Company 398,347 3,088 2,877 3% 61% Here4U 269,038 2,086 1,568 2% 59% XYZ Inc 208,819 1,619 1,362 2% 29% Expert Engineers 207,066 1,605 1,561 2% 52% Check Gmbh 201,704 1,564 1,023 1% 49% Francios and Sons 186,532 S 1,446 960 19% 49% Euro Ltd 177,660 5 1,377_5 21,392 5 1,215 1% 54% Marketing Accounts 2,759,521 5 20,029 20% 63%Global Breakout Revenue % Total PM Sales Amt (+/-) GP S 7,024,096 100% 58% 8.3% 538,319 6.5% Domestic 6,145,978 87% 60% 8.0% 455,258 6.6% INTL 878,119 13% 48% 11.1% 87,733 5.7% Customer Rank Revenue % Total PM Sales Amt (+/-) GP Acquire 654,170 9% 58% 50.8% 220,370 42.7% Expand 4,017,070 57% 58% 3.0% 117,002 0.6% Retain 1,505,103 21% 59% 10.4% 141,785 10.3% Serve 843,966 12% 60% 7.4% 58,150 8.0% Non-Coded 3,787 0% Customer Class Revenue Total PM Sales Amt (+/-) GP Commercial 3,719,525 53% 8.5% 291,391 6.8% INTL 868,634 12% 48% 10.9% 85,375 5.2% Municipal 814,624 12% 63% 1.7% 13,617 1.7% Reseller 721,253 10% 61% 10.9% 70,890 6.8% Industrial Labs 464,827 7% 58% 14.2% 57,798 12.8% Government 183,030 3% 58% 14.2% 22,759 12.8% Resell - Industrial Hygiene 140,804 29% 32%% -8.4% -12,912 -14.2% Education 84,981 1% 61% 2.1% 1,748 -3.8% Other 26,418 0% Top Customers Revenue % Total PM Sales Amt (+/-) GP ABC Corp 332,350 5% 63% 7.2% 22,322 4.2% Fish Limited 239,460 3% 67% 18.1% 36,700 16.3% Delta Appliance 230,032 3% 53% -21.0% -61,148 14.7% ALPS Company 226,766 3% 61% 8.8% 18,341 12.3% Here4U 119,433 29% 59% 31.9% 28,885 28.0% XYZ Inc 117,490 2% 119 213.1% 79,965 16.8% Expert Engineers 104,936 1% 52% 22.1% 18,993 8.6% Check Gmbh 100,171 19% 48%% 2835.2% 96,758 3186.6% Francios and Sons 96,755 19% 50% -7.0% -7,283 -16.9% Euro Ltd 75,156 1% 55% 19.1% 12,053 19.1% Marketing Accounts 1,381,927 20% 63% 8.9% 112,940 6.3%Global Breakout Revenue % Total PM Sales GP S 2,257,102 100% 56% 11.2% 6.1% Domestic 1,930,466 86%% 58% 4.29% 2.3% INTL 326,636 14% 42% 83.4% 52.4% Customer Rank Net Sales % Total PM Sales GP Acquire 219,791 10% 56%% 64.3% 40.2% Expand 1,282,340 57% 55% 8.1% 0.5% Retain 477,879 21% 57% 18.0% 17.3% Serve 273,533 12% 57% 18.0% 17.3% Non-Coded 3,559 0% Customer Class Net Sales Total PM Sales GP Commercial 1,130,973 50% 60% L.0% 1.0% INTL 323,990 14% 51% 83.2% 50.8% Municipal 263,030 12% 60% 12.3% 3.4% Reseller - Other 266,066 12% 57% 26.4% 14.9% Industrial Labs 135,694 6% 59% -7.4% 2.6% Government 50,261 2% 61% 30.9% 33.8% Resell - Industrial Hygiene 43,642 2% 29% -39.7% -50.1% Education 35,846 2% 60% 25.6% 14.4% Other 7.600 08% Top Customers Net Sales % Total PM Sales GP ABC Corp 87,955 4% 52% 2.6% 10.9% Fish Limited 76,813 3% 66% 6.49% 1.3% Delta Appliance 75,000 3% -1% 5258.2% -164.1% ALPS Company 60,179 3% 59% -10.7% -10.4% Here4U 56,444 3% 52% 100.0% XYZ Inc 51,610 29% 56% -23.0% -0.5% Expert Engineers 35,156 2% 57% -8.2% -11.3% Check Gmbh 31,740 1% 45% -7.1% -27.9% Francios and Sons 29,154 1% 54% 3.7% 5.0% Euro Ltd 28,452 58% 126.6% 119.5% Marketing Accounts 447,025 20% 56% 6.4% 6.8%