

Question
You are Controller for the Transportation Division of Second Data Inc. A new manager for the division has been appointed and is trying to understand
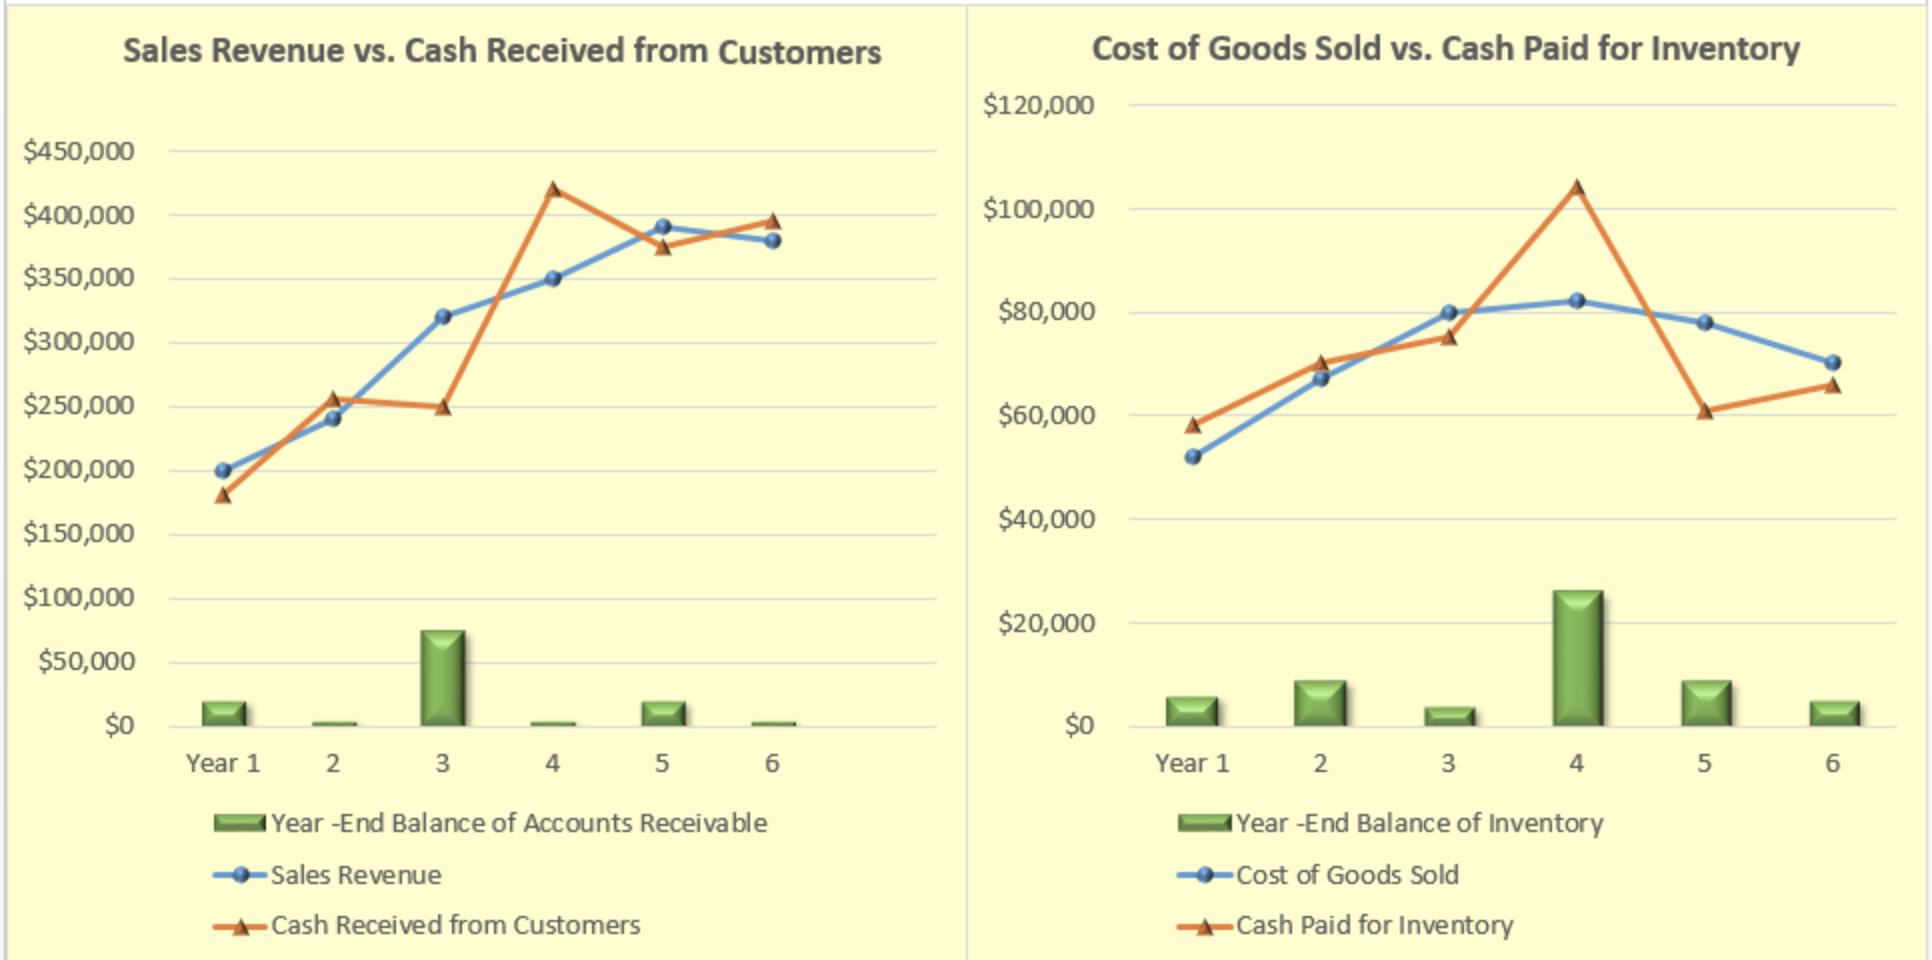
You are Controller for the Transportation Division of Second Data Inc. A new manager for the division has been appointed and is trying to understand all aspects of operations. Most of her training and experience is in marketing and is having trouble grasping accrual accounting. To aid in your explanation to the manager you derived the graphs below. Presented in the left graph are trends in sales revenue and cash received from customers over a six-year period. In the right graph are trends in cost of goods sold and cash paid for inventory over a six-year period. All inventory is purchased with cash.
Step by Step Solution
There are 3 Steps involved in it
Step: 1

Get Instant Access to Expert-Tailored Solutions
See step-by-step solutions with expert insights and AI powered tools for academic success
Step: 2

Step: 3
Ace Your Homework with AI
Get the answers you need in no time with our AI-driven, step-by-step assistance
Get Started
Financial Analysis
Authors: Paul Rodgers
4th Edition
075068674X, 978-0750686747