

Answered step by step
Verified Expert Solution
Question
1 Approved Answer
you are examining the potfolio You are examining a portfolio consisting of three stocks. Using the data in the table a. Compute the annual returns
you are examining the potfolio 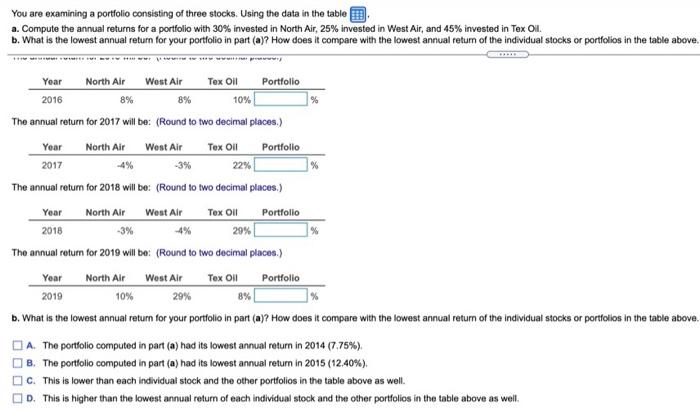
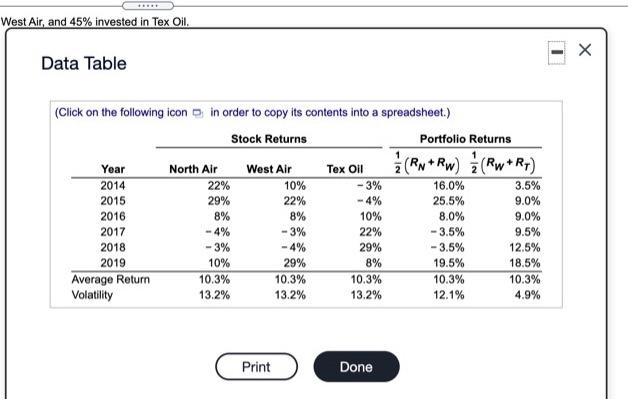
You are examining a portfolio consisting of three stocks. Using the data in the table a. Compute the annual returns for a portfolio with 30% invested in North Air, 25% invested in West Air, and 45% invested in Tex Oil b. What is the lowest annual return for your portfolio in part (a)? How does it compare with the lowest annual return of the individual stocks or portfolios in the table above * 8% % % Year North Air West Air Tex Olt Portfolio 2016 8% 10% The annual return for 2017 will be: (Round to two decimal places.) Year North Air West Air Tex Oil Portfolio 2017 -3% 22% The annual return for 2018 will be: (Round to two decimal places.) Year North Air West Air Tex Oil Portfolio 2018 -3% 4% 29% The annual return for 2019 will be: (Round to two decimal places.) Year North Air West Air Tex Oil Portfolio 2019 10% 29% 8% b. What is the lowest annual return for your portfolio in part (a)? How does it compare with the lowest annual return of the individual stocks or portfolios in the table above. A. The portfolio computed in part (a) had its lowest annual return in 2014 (7.75%) B. The portfolio computed in part (a) had its lowest annual return in 2015 (12.40%). C. This is lower than each individual stock and the other portfolios in the table above as well. D. This is higher than the lowest annual return of each individual stock and the other portfolios in the table above as well, West Air, and 45% invested in Tex Oil. Data Table (Click on the following icon in order to copy its contents into a spreadsheet.) Stock Returns Portfolio Returns Year North Air West Air Tex Oil (Rw+Rw) (Rw+R1) 2014 22% 10% -3% 16.0% 3.5% 2015 29% - 4% 25.5% 9.0% 2016 8% 8% 10% 8.0% 9.0% 2017 -4% - 3% 22% -3.5% 9.5% 2018 - 3% - 4% 29% -3.5% 12.5% 2019 10% 29% 8% 19.5% 18.5% Average Return 10.3% 10.3% 10.3% 10.3% 10.3% Volatility 13.2% 13.2% 13.2% 12.1% 4.9% 22% Print Done Step by Step Solution
There are 3 Steps involved in it
Step: 1

Get Instant Access to Expert-Tailored Solutions
See step-by-step solutions with expert insights and AI powered tools for academic success
Step: 2

Step: 3
Ace Your Homework with AI
Get the answers you need in no time with our AI-driven, step-by-step assistance
Get Started
Futures Trading Demystified
Authors: Arvind Rajpurohit
1st Edition
979-8859974344