

Question
You are given the following budgeted and actual data for the Grey Company for each of the months January through June of the current year.
You are given the following budgeted and actual data for the Grey Company for each of the months January through June of the current year.
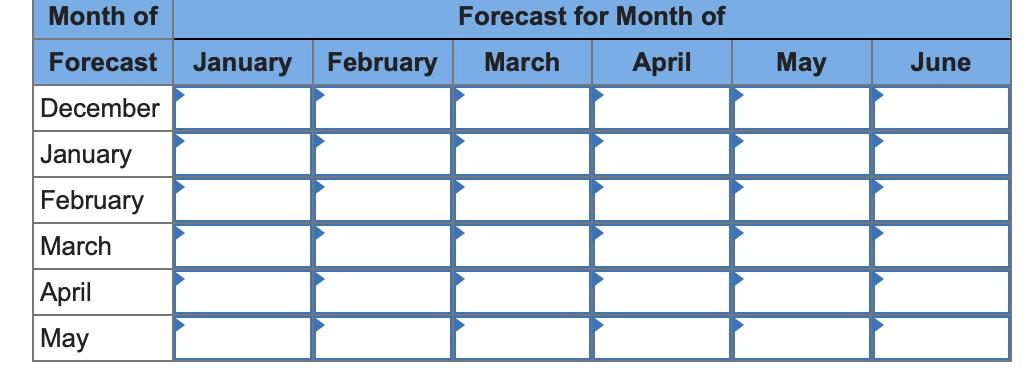
In December of the prior year, sales were forecasted as follows: January, 94 units; February, 89 units; March, 96 units; April, 101 units; May, 108 units; June, 116 units. In January of the current year, sales for the months February through June were reforecasted as follows: February, 84 units; March, 96 units; April, 96 units; May, 98 units; June, 111 units. In February of the current year, sales for the months March through June were reforecasted as follows: March, 91 units; April, 96 units; May, 93 units; June, 111 units. In March of the current year, sales for the months April through June were reforecasted as follows: April, 96 units; May, 88 units; June, 101 units. In April of the current year, sales for the months May and June were reforecasted as follows: May, 78 units; June, 96 units. In May of the current year, sales for June were reforecasted as 96 units.
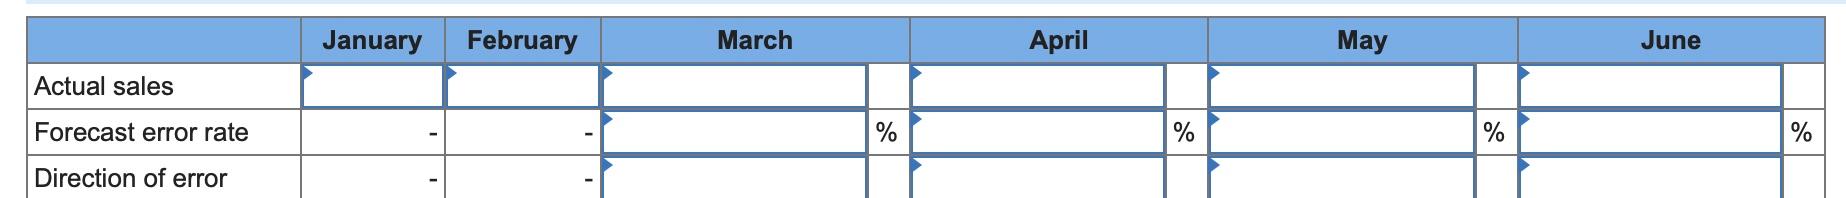
Actual sales for the six-month period, January through June, were as follows: January, 84 units; February, 84 units; March, 98 units; April, 90 units; May, 99 units; June, 108 units.
Required:
1. Prepare a schedule of forecasted sales, on a rolling basis, for the months January through June, inclusive. (Hint: There will be only one forecasted number for Januarythis is the forecast done in December. For February, there will be two forecasts: one done in December and a second done in January. For June, there will be six forecasts, one done in each of the preceding six months.)
2. For each of the months March through June, determine the 3-month forecast error rate, defined as 1 minus the absolute percentage error. For example, the forecast error rate for Marchs sales is found by dividing the absolute value of the forecast error for this month by the actual sales volume for the month. The forecast error for any month (e.g., March) is defined as the difference between the actual sales volume for the month and the sales volume for that month forecasted 3 months earlier (e.g., December). Also, indicate for each month whether the actual sales volume was above or below the forecasted volume generated three months earlier.
\begin{tabular}{|l|l|l|l|l|l|l|} \hline Month of & \multicolumn{5}{c|}{ Forecast for Month of } \\ \hline Forecast & January & February & March & April & May & June \\ \hline December & & & & & & \\ \hline January & & & & & \\ \hline February & & & & \\ \hline March & & & & \\ \hline April & & & & \\ \hline May & & & & \\ \hline \end{tabular} \begin{tabular}{|l|l|l|l|l|l|l|} \hline Month of & \multicolumn{5}{c|}{ Forecast for Month of } \\ \hline Forecast & January & February & March & April & May & June \\ \hline December & & & & & & \\ \hline January & & & & & \\ \hline February & & & & \\ \hline March & & & & \\ \hline April & & & & \\ \hline May & & & & \\ \hline \end{tabular}
Step by Step Solution
There are 3 Steps involved in it
Step: 1

Get Instant Access to Expert-Tailored Solutions
See step-by-step solutions with expert insights and AI powered tools for academic success
Step: 2

Step: 3
Ace Your Homework with AI
Get the answers you need in no time with our AI-driven, step-by-step assistance
Get Started
Internal Audit Handbook Management With The SAP Audit Roadmap
Authors: Henning Kagermann, William Kinney, Karlheinz Küting, Claus-Peter Weber, Z. Keil, C. Boecker, J. Busch, O. Bussiek, M. H. Christ, P. Eckes, M. Falk, P. S. Greenberg, B. Reichert, M. Wolf
2008th Edition
3642430392, 978-3642430398