

Answered step by step
Verified Expert Solution
Question
1 Approved Answer
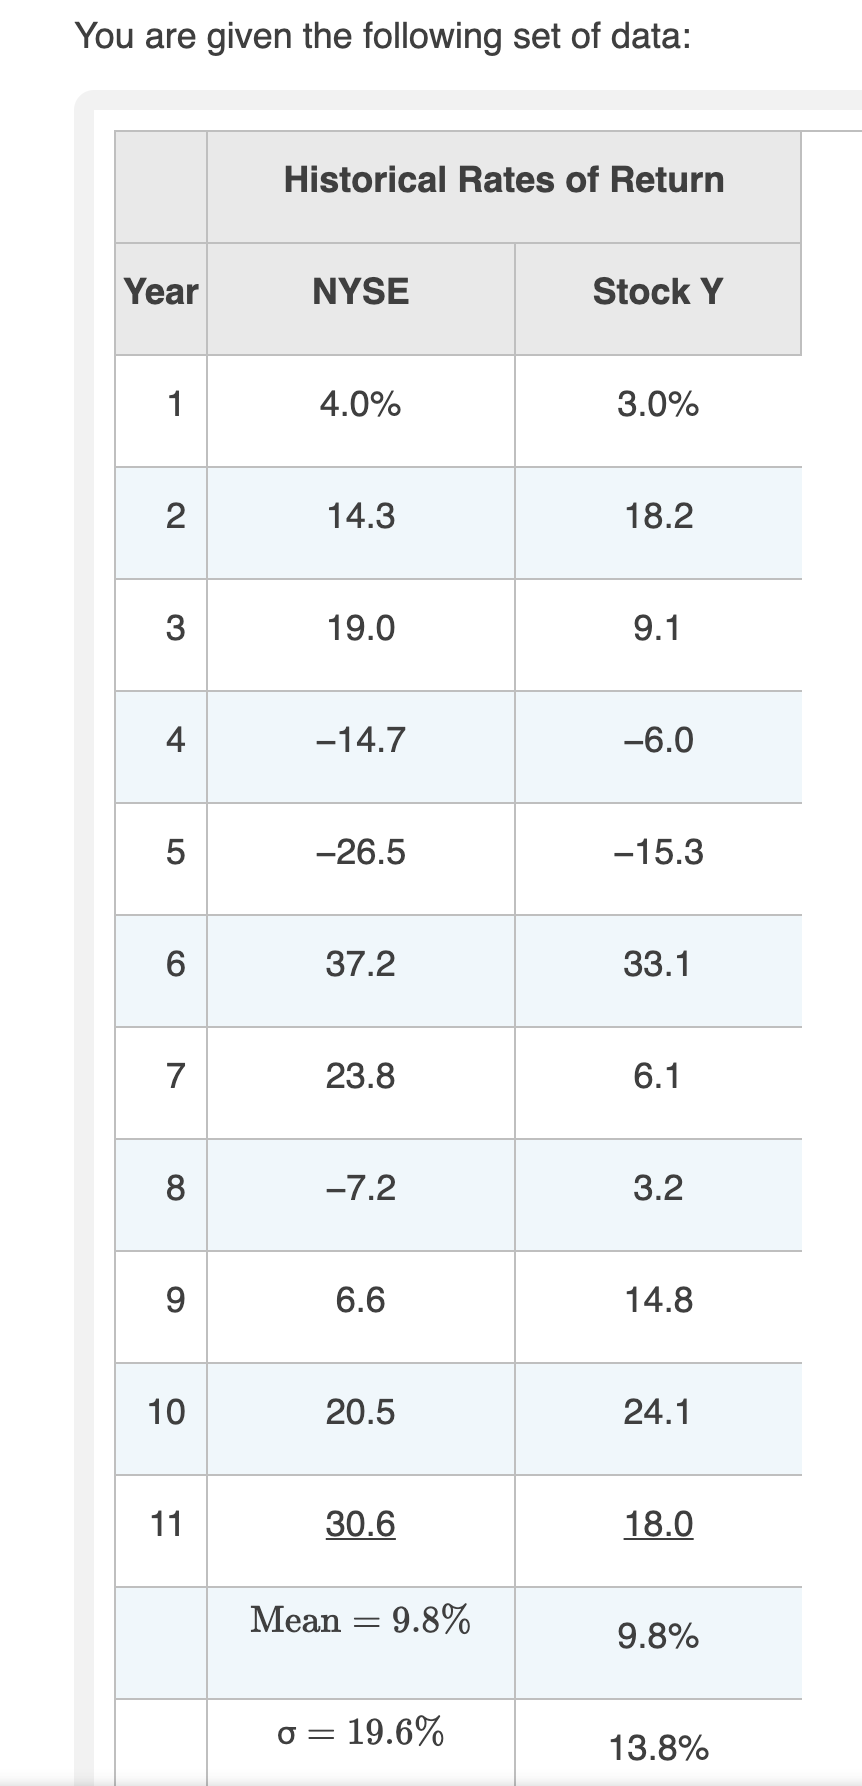
You are given the following set of data: Historical Rates of Return Year NYSE Stock Y 1 4.0% 3.0% 2 14.3 18.2 3 19.0 9.1
Step by Step Solution
There are 3 Steps involved in it
Step: 1

Get Instant Access to Expert-Tailored Solutions
See step-by-step solutions with expert insights and AI powered tools for academic success
Step: 2

Step: 3
Ace Your Homework with AI
Get the answers you need in no time with our AI-driven, step-by-step assistance
Get Started
Cryptocurrency And Public Policy
Authors: Donavon Johnson
1st Edition
1032311231, 978-1032311234