

Question
You are given the position and time data of an underdamped mass damper as massDamperData.csv on canvas: (the first column is time measurements in seconds,
You are given the position and time data of an underdamped mass damper as massDamperData.csv on canvas:
(the first column is time measurements in seconds, the second column is position measurements in cm). Use Matlab
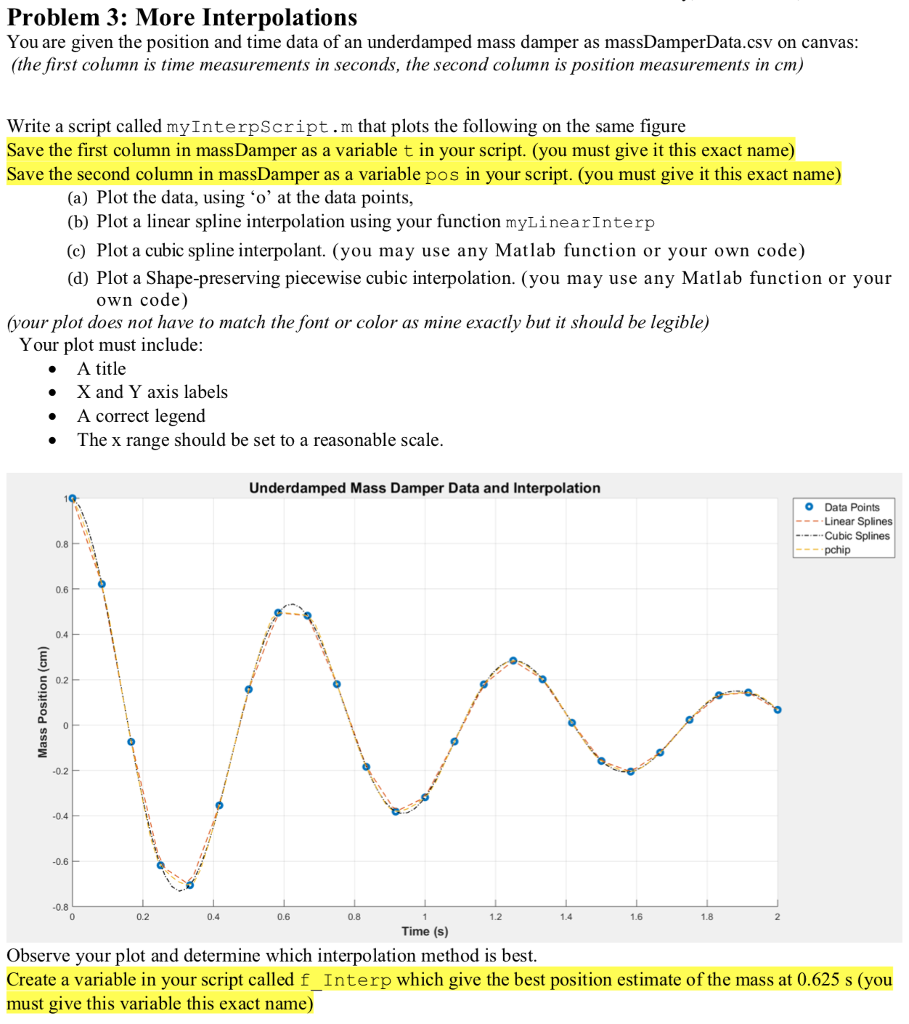
Problem 3: More Interpolations You are given the position and time data of an underdamped mass damper as massDamperData.csv on canvas (the first column is time measurements in seconds, the second column is position measurements in cm) Write a script called myInterpScript.m that plots the following on the same figure Save the first column in massDamper as a variable t in your script. (you must give it this exact name) Save the second column in massDamper as a variable pos in your script. (you must give it this exact name) (a) Plot the data, using o' at the data points. (b) Plot a linear spline interpolation using your function myLinearInterp (c) Plot a cubic spline interpolant. (you may use any Matlab function or your own code) (d) Plot a Shape-preserving piecewise cubic interpolation. (you may use any Matlab function or your own code) (your plot does not have to match the font or color as mine exactly but it should be legible) Your plot must include: A title . X and Y axis labels A correct legend The x range should be set to a reasonable scale Underdamped Mass Damper Data and Interpolation O Data Points Linear Splines Cubic Splines pchip 0.8 0.6 0.4 E 0.2 0.2 0.6 0.8 0.2 0.4 0.6 0.8 1.2 1.4 1.6 1.8 Time (s) Observe your plot and determine which interpolation method is best. Create a variable in your script called f_Interp which give the best position estimate of the mass at 0.625 s (you must give this variable this exact name) Problem 3: More Interpolations You are given the position and time data of an underdamped mass damper as massDamperData.csv on canvas (the first column is time measurements in seconds, the second column is position measurements in cm) Write a script called myInterpScript.m that plots the following on the same figure Save the first column in massDamper as a variable t in your script. (you must give it this exact name) Save the second column in massDamper as a variable pos in your script. (you must give it this exact name) (a) Plot the data, using o' at the data points. (b) Plot a linear spline interpolation using your function myLinearInterp (c) Plot a cubic spline interpolant. (you may use any Matlab function or your own code) (d) Plot a Shape-preserving piecewise cubic interpolation. (you may use any Matlab function or your own code) (your plot does not have to match the font or color as mine exactly but it should be legible) Your plot must include: A title . X and Y axis labels A correct legend The x range should be set to a reasonable scale Underdamped Mass Damper Data and Interpolation O Data Points Linear Splines Cubic Splines pchip 0.8 0.6 0.4 E 0.2 0.2 0.6 0.8 0.2 0.4 0.6 0.8 1.2 1.4 1.6 1.8 Time (s) Observe your plot and determine which interpolation method is best. Create a variable in your script called f_Interp which give the best position estimate of the mass at 0.625 s (you must give this variable this exact name)
Step by Step Solution
There are 3 Steps involved in it
Step: 1

Get Instant Access to Expert-Tailored Solutions
See step-by-step solutions with expert insights and AI powered tools for academic success
Step: 2

Step: 3
Ace Your Homework with AI
Get the answers you need in no time with our AI-driven, step-by-step assistance
Get Started
Performing With Computer Applications Personal Information Manager Word Processing Desktop Publishing Spreadsheets Databases Presentations Assessment Manager
Authors: Iris Blanc
3rd Edition
141886515X, 978-1418865153