

Question
You are going to make a projection for 20 years You can use the same assumptions given in the 15 years projection Revenues and costs
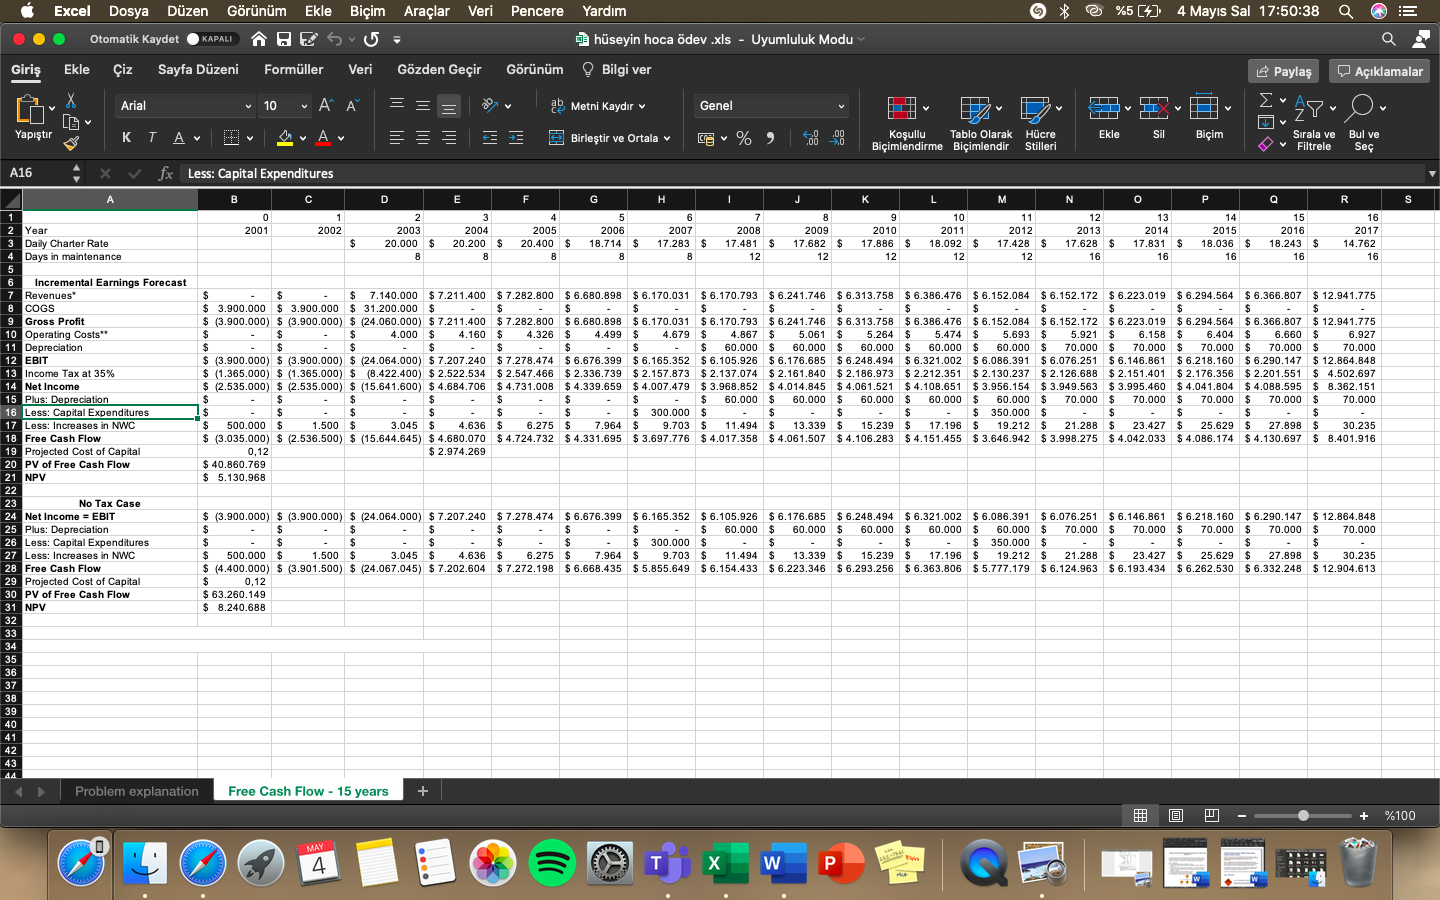
You are going to make a projection for 20 years You can use the same assumptions given in the 15 years projection Revenues and costs increase with the inflation rate of 4 % Scrap value of the vessel is 5000000 USD Please also find the IRR
Pencere Yardm e %5 (4) 4 Mays Sal 17:50:38 Excel Dosya Dzen Grnm Ekle Biim Ekle Biim Aralar Veri Otomatik Kaydet KAPALI HESU- 0 hseyin hoca dev .xls - Uyumluluk Modu O Giri Ekle iz Sayfa Dzeni Formller Veri Gzden Geir Grnm Bilgi ver Aklamalar Payla Arial T 10 v " EEE ab Metni kaydr Genel TV TT 2xu O UW V Yaptr 60 a.A Av === Birletir ve Ortala v V Ekle ,00 0 Sil %) Koullu Tablo Olarak Hcre Biimlendirme Biimlendir Stilleri Biim Srala ve Filtrele Bul ve Se A16 fx Less: Capital Expenditures S A B D E F G H I J L M N O P Q R 0 1 2 3 4 5 6 7 8 9 10 11 12 13 14 15 16 2 Year 2001 2002 2003 2004 2005 2006 2007 2008 2009 2010 2011 2012 2013 2014 2015 2016 2017 3 Daily Charter Rate $ 20.000 $ 20.200 $ 20.400 $ 18.714 $ 17.283 $ 17.481 $ 17.682 $ 17.886 $ 18.092 $ 17.428 $ 17.628 $ 17.831 $ 18.036 $ 18.243 $ 14.762 4 Days in maintenance 8 8 8 8 8 12 12 12 12 12 16 16 16 16 16 5 6 Incremental Earnings Forecast 7 Revenues $ $ $ 7.140.000 $ 7.211.400 $ 7.282.800 $ 6.680.898 $ 6.680.898 $ 6.170.031 $ 6.170.793 $ 6.241.746 $ 6.313.758 $ 6.386.476 $ 6.152.084 $ 6.152.172 $ 6.223.019 $ 6.294.564 $ 6.366.807 $12.941.775 8 COGS $ 3.900.000 $ 3.900.000 $ 31.200.000 $ $ $ $ $ $ $ $ $ $ $ $ $ $ 9 Gross Profit $ (3.900.000) $ (3.900.000) $ (24.060.000) $ 7.211.400 $ 7.282.800 $6.680.898 $6.170.031 $6.170.793 $ 6.170.793 $ 6.241.746 $ 6.313.758 $ 6.386.476 $ 6.152.084 $ 6.313.758 $ 6.386.476 $ 6.152.084 $ 6.152.172 $ 6.223.019 $ 6.294.564 $ 6.366.807 $ 12.94 1.775 $ $ 10 Operating Costs" $ $ $ 4.000 $ 4.160 $ 4.326 $ 4.499 $ $ 4.679 $ 4.867 $ 5.061 $ 5.264 $ 5.474 $ 5.693 $ 5.921 S 6.158 $ 6.404 $ 6.660 $ 6.927 11 Depreciation $ $ $ $ $ $ $ $ $ 60.000 $ 60.000 $ 60.000 $ 60.000 $ 60.000 $ 70.000 $ 70.000 70.000 $ 70.000 $ 70.000 $ 70.000 12 EBIT $ (3.900.000) $ (3.900.000) $ (24.064.000) $ 7.207.240 $ 7.278.474 $ 6.676.399 $6.165.352 $ 6.105.926 $6.176.685 $ 6.248.494 $6.321.002 $ 6.086.391 $ 6.076.251 $ 6.146.861 $ 6.218.160 $ 6.290.147 $ 12.864.848 13 Income Tax at 35% $ (1.365.000) $ (1.365.000) $ (8.422.400) $ 2.522.534 $ 2.547.466 $ 2.336.739 $ 2.157.873 $ 2.137.074 $ 2.161.840 $ 2.186.973 $ 2.212.351 $ 2.130.237 $ 2.126.688 $ 2.151.401 $ 2.176.356 $2.201.551 $ 4.502.697 $ 14 Net Income $ (2.535.000) $ (2.535.000) $ (15.641.600) $ 4.684.706 $ 4.731.008 $ 4.339.659 $4.007.479 $ 3.968.852 $ 4.014.845 $ 4.061.521 $ 4.108.651 $ 3.956.154 $ 3.949.563 $3.995.460 $ 4.041.804 $ 4.088.595 $ 8.362.151 15 Plus: Depreciation $ $ $ $ $ $ $ $ 60.000 $ 60.000 $ 60.000 $ 60.000 $ 60.000 $ 70.000 $ 70.000 $ 70.000 $ 70.000 $ 70.000 16 Less: Capital Expenditures $ $ $ $ $ $ $ 300.000 $ $ $ $ $ 350.000 $ $ $ $ $ 17 Less: Increases in NWC $ 500.000 $ 1.500 $ 3.045 $ 4.636 $ 6.275 $ 7.964 $ 9.703 $ 11.494 $ 13.339 $ 15.239 $ 17.196 $ 19.212 $ 21.288 $ 23.427 $ 25.629 $ 27.898 $ 30.235 18 Free Cash Flow $ (3.035.000) $ (2.536.500) $ (15.644.645) $ 4.680.070 $ 4.724.732 $ 4.331.695 $ 3.697.776 $ 4.017.358 $ 4.061.507 $ 4.106.283 $ 4.151.455 $ 3.646.942 $ 3.998.275 $ 4.042.033 $ 4.086.174 $ 4.130.697 $ 8.401.916 19 Projected Cost of Capital 0,12 $ 2.974.269 20 PV of Free Cash Flow $ 40.860.769 21 NPV $ 5.130.968 22 23 No Tax Case 24 Net Income = EBIT $ (3.900.000) $ (3.900.000) $ (24.064.000) $ 7.207.240 $ 7.278.474 $ 6.676.399 $ 6.165.352 $ 6.105.926 $6.176.685 $ 6.248.494 $6.321.002 $ 6.086.391 $ 6.076.251 $ 6.146.861 $ 6.218.160 $ 6.290.147 $ 12.864.848 25 Plus: Depreciation $ $ $ $ $ $ $ $ 60.000 $ 60.000 $ 60.000 $ 60.000 $ 60.000 $ 70.000 $ 70.000 $ 70.000 $ 70.000 $ 70.000 26 Less: Capital Expenditures $ $ $ $ $ $ $ $ 300.000 $ $ $ $ $ 350.000 $ $ $ $ $ 27 Less: Increases in NWC $ 500.000 $ 1.500 $ 3.045 $ 4.636 $ 6.275 $ 7.964 $ 9.703 $ 11.494 $ 13.339 $ 15.239 $ 17.196 $ 19.212 $ 21.288 $ 23.427 $ 25.629 $ 27.898 $ 30.235 28 Free Cash Flow $ (4.400.000) $ (3.901.500) $ (24.067.045) $ 7.202.604 $ 7.272.198 $6.668.435 $5.855.649 $6.154.433 $ 6.223.346 $ 6.293.256 $6.363.806 $ 5.777.179 $ 6.124.963 $ $ 6.193.434 $ 6.262.530 $ 6.332.248 $ 12.904.613 29 Projected Cost of Capital $ 0,12 30 PV of Free Cash Flow $ 63.260.149 31 NPV $ 8.240.688 32 33 34 35 36 37 38 39 40 41 42 43 44 Problem explanation Free Cash Flow - 15 years + 3 %100 MAY 4 * W P SED Pencere Yardm e %5 (4) 4 Mays Sal 17:50:38 Excel Dosya Dzen Grnm Ekle Biim Ekle Biim Aralar Veri Otomatik Kaydet KAPALI HESU- 0 hseyin hoca dev .xls - Uyumluluk Modu O Giri Ekle iz Sayfa Dzeni Formller Veri Gzden Geir Grnm Bilgi ver Aklamalar Payla Arial T 10 v " EEE ab Metni kaydr Genel TV TT 2xu O UW V Yaptr 60 a.A Av === Birletir ve Ortala v V Ekle ,00 0 Sil %) Koullu Tablo Olarak Hcre Biimlendirme Biimlendir Stilleri Biim Srala ve Filtrele Bul ve Se A16 fx Less: Capital Expenditures S A B D E F G H I J L M N O P Q R 0 1 2 3 4 5 6 7 8 9 10 11 12 13 14 15 16 2 Year 2001 2002 2003 2004 2005 2006 2007 2008 2009 2010 2011 2012 2013 2014 2015 2016 2017 3 Daily Charter Rate $ 20.000 $ 20.200 $ 20.400 $ 18.714 $ 17.283 $ 17.481 $ 17.682 $ 17.886 $ 18.092 $ 17.428 $ 17.628 $ 17.831 $ 18.036 $ 18.243 $ 14.762 4 Days in maintenance 8 8 8 8 8 12 12 12 12 12 16 16 16 16 16 5 6 Incremental Earnings Forecast 7 Revenues $ $ $ 7.140.000 $ 7.211.400 $ 7.282.800 $ 6.680.898 $ 6.680.898 $ 6.170.031 $ 6.170.793 $ 6.241.746 $ 6.313.758 $ 6.386.476 $ 6.152.084 $ 6.152.172 $ 6.223.019 $ 6.294.564 $ 6.366.807 $12.941.775 8 COGS $ 3.900.000 $ 3.900.000 $ 31.200.000 $ $ $ $ $ $ $ $ $ $ $ $ $ $ 9 Gross Profit $ (3.900.000) $ (3.900.000) $ (24.060.000) $ 7.211.400 $ 7.282.800 $6.680.898 $6.170.031 $6.170.793 $ 6.170.793 $ 6.241.746 $ 6.313.758 $ 6.386.476 $ 6.152.084 $ 6.313.758 $ 6.386.476 $ 6.152.084 $ 6.152.172 $ 6.223.019 $ 6.294.564 $ 6.366.807 $ 12.94 1.775 $ $ 10 Operating Costs" $ $ $ 4.000 $ 4.160 $ 4.326 $ 4.499 $ $ 4.679 $ 4.867 $ 5.061 $ 5.264 $ 5.474 $ 5.693 $ 5.921 S 6.158 $ 6.404 $ 6.660 $ 6.927 11 Depreciation $ $ $ $ $ $ $ $ $ 60.000 $ 60.000 $ 60.000 $ 60.000 $ 60.000 $ 70.000 $ 70.000 70.000 $ 70.000 $ 70.000 $ 70.000 12 EBIT $ (3.900.000) $ (3.900.000) $ (24.064.000) $ 7.207.240 $ 7.278.474 $ 6.676.399 $6.165.352 $ 6.105.926 $6.176.685 $ 6.248.494 $6.321.002 $ 6.086.391 $ 6.076.251 $ 6.146.861 $ 6.218.160 $ 6.290.147 $ 12.864.848 13 Income Tax at 35% $ (1.365.000) $ (1.365.000) $ (8.422.400) $ 2.522.534 $ 2.547.466 $ 2.336.739 $ 2.157.873 $ 2.137.074 $ 2.161.840 $ 2.186.973 $ 2.212.351 $ 2.130.237 $ 2.126.688 $ 2.151.401 $ 2.176.356 $2.201.551 $ 4.502.697 $ 14 Net Income $ (2.535.000) $ (2.535.000) $ (15.641.600) $ 4.684.706 $ 4.731.008 $ 4.339.659 $4.007.479 $ 3.968.852 $ 4.014.845 $ 4.061.521 $ 4.108.651 $ 3.956.154 $ 3.949.563 $3.995.460 $ 4.041.804 $ 4.088.595 $ 8.362.151 15 Plus: Depreciation $ $ $ $ $ $ $ $ 60.000 $ 60.000 $ 60.000 $ 60.000 $ 60.000 $ 70.000 $ 70.000 $ 70.000 $ 70.000 $ 70.000 16 Less: Capital Expenditures $ $ $ $ $ $ $ 300.000 $ $ $ $ $ 350.000 $ $ $ $ $ 17 Less: Increases in NWC $ 500.000 $ 1.500 $ 3.045 $ 4.636 $ 6.275 $ 7.964 $ 9.703 $ 11.494 $ 13.339 $ 15.239 $ 17.196 $ 19.212 $ 21.288 $ 23.427 $ 25.629 $ 27.898 $ 30.235 18 Free Cash Flow $ (3.035.000) $ (2.536.500) $ (15.644.645) $ 4.680.070 $ 4.724.732 $ 4.331.695 $ 3.697.776 $ 4.017.358 $ 4.061.507 $ 4.106.283 $ 4.151.455 $ 3.646.942 $ 3.998.275 $ 4.042.033 $ 4.086.174 $ 4.130.697 $ 8.401.916 19 Projected Cost of Capital 0,12 $ 2.974.269 20 PV of Free Cash Flow $ 40.860.769 21 NPV $ 5.130.968 22 23 No Tax Case 24 Net Income = EBIT $ (3.900.000) $ (3.900.000) $ (24.064.000) $ 7.207.240 $ 7.278.474 $ 6.676.399 $ 6.165.352 $ 6.105.926 $6.176.685 $ 6.248.494 $6.321.002 $ 6.086.391 $ 6.076.251 $ 6.146.861 $ 6.218.160 $ 6.290.147 $ 12.864.848 25 Plus: Depreciation $ $ $ $ $ $ $ $ 60.000 $ 60.000 $ 60.000 $ 60.000 $ 60.000 $ 70.000 $ 70.000 $ 70.000 $ 70.000 $ 70.000 26 Less: Capital Expenditures $ $ $ $ $ $ $ $ 300.000 $ $ $ $ $ 350.000 $ $ $ $ $ 27 Less: Increases in NWC $ 500.000 $ 1.500 $ 3.045 $ 4.636 $ 6.275 $ 7.964 $ 9.703 $ 11.494 $ 13.339 $ 15.239 $ 17.196 $ 19.212 $ 21.288 $ 23.427 $ 25.629 $ 27.898 $ 30.235 28 Free Cash Flow $ (4.400.000) $ (3.901.500) $ (24.067.045) $ 7.202.604 $ 7.272.198 $6.668.435 $5.855.649 $6.154.433 $ 6.223.346 $ 6.293.256 $6.363.806 $ 5.777.179 $ 6.124.963 $ $ 6.193.434 $ 6.262.530 $ 6.332.248 $ 12.904.613 29 Projected Cost of Capital $ 0,12 30 PV of Free Cash Flow $ 63.260.149 31 NPV $ 8.240.688 32 33 34 35 36 37 38 39 40 41 42 43 44 Problem explanation Free Cash Flow - 15 years + 3 %100 MAY 4 * W P SEDStep by Step Solution
There are 3 Steps involved in it
Step: 1

Get Instant Access to Expert-Tailored Solutions
See step-by-step solutions with expert insights and AI powered tools for academic success
Step: 2

Step: 3
Ace Your Homework with AI
Get the answers you need in no time with our AI-driven, step-by-step assistance
Get Started
An Introduction to Investment Banks, Hedge Funds, and Private Equity
Authors: David P. Stowell
1st edition
978-0123745033, 0123745039, 978-9380931074