Question
You are hired as a data scientist at International Trade Administration Industry and Analysis National Travel and Tourism Office, a national bureau dedicating to enhancing
You are hired as a data scientist at International Trade Administration Industry and Analysis National Travel and Tourism Office, a national bureau dedicating to enhancing tourism in the United States, and get involved in the International Visitation and Spending in the United States project. Towards the end of a fiscal year, you received a request from the headquarter to obtain insights based on the given tourist visitation number for different states in the U.S. Specifically, you are asked to produce a Jupyter notebook with visualizations that can interact with the 3-year US international visitation data and engage a meeting with various stakeholders, including the headquarter of national travel and tourism in a high-profile video conference.
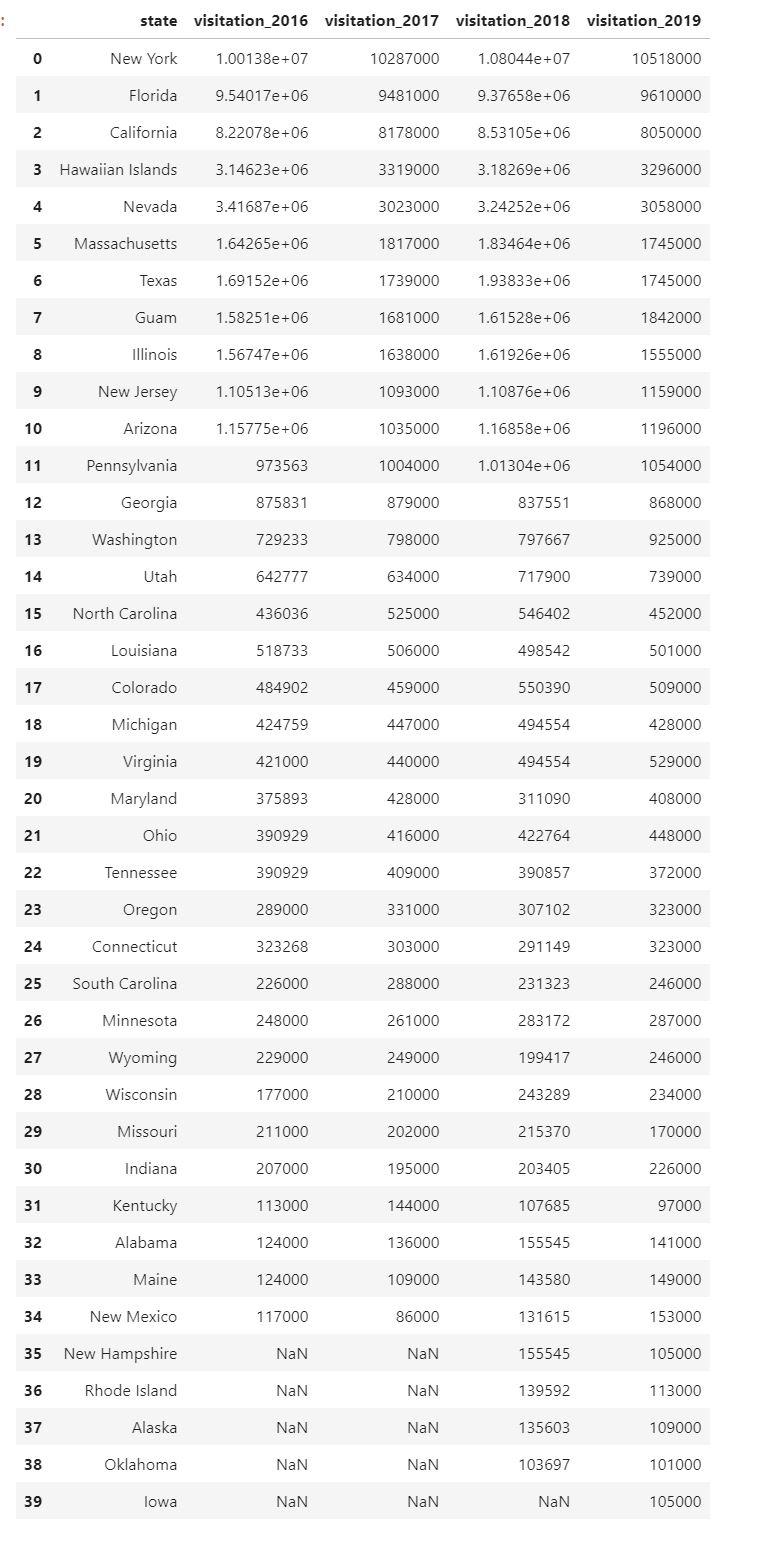
Below is the dataset:
Part A:
Make use of the merged data to complete the function make_bar_chart below. The elements requested by the management team for the first visualization are:
- Make 4 plots, each of which is a bar chart representing the total visitation (as y-axis) of each state (shown in x-axis) in year 2016, 2017, 2018 and 2019. Each plot should use the data for each year.
- Make the figures readable by adjusting the figure size, and specify the year of each plot using the title (e.g., A proper title of the plot using 2016 visitation data could be something like Visitation data 2016.)
def make_bar_chart(data): return None
make_bar_chart(load_data())
Part B:
After a week, the management team returned the report back to you can say "Hey! The visualization looks highly skewed. We could hardly see what is happening in the last few states."
To better visualize the visitation data to the stakeholders, your manager told you a new requirement: perform log-transformation on the visitation number and make the same bar charts again and:
- Build the bar chart again with all visitation number log-transformed
- (Optional) If you want, you can annotate inside the graphs about the trend you observe in the new subplots. (E.g. In what way does log-transformation improve the visualizations?)
def make_transformed_bar_chart(data): return None
make_transformed_bar_chart(load_data())
: state visitation 2016 visitation 2017 visitation 2018 visitation_2019 0 New York 1.00138e+07 10287000 1.08044e+07 10518000 1 Florida 9.54017e+06 9481000 9.37658e +06 9610000 2 California 8.22078e +06 8178000 8.53105e+06 8050000 3 Hawaiian Islands 3.14623e+06 3319000 3.18269e+06 3296000 4 Nevada 3.41687e+06 3023000 3.24252e+06 3058000 5 Massachusetts 1.64265e+06 1817000 1.83464e +06 1745000 6 Texas 1.69152e+06 1739000 1.93833e+06 1745000 7 Guam 1.58251e+06 1681000 1.61528e+06 1842000 8 Illinois 1.56747e+06 1638000 1.61926e+06 1555000 9 New Jersey 1.10513e+06 1093000 1.10876e+06 1159000 10 Arizona 1.15775e+06 1035000 1.16858e+06 1196000 11 Pennsylvania 973563 1004000 1.01304e+06 1054000 12 Georgia 875831 879000 837551 868000 13 Washington 729233 798000 797667 925000 14 Utah 642777 634000 717900 739000 15 North Carolina 436036 525000 546402 452000 16 Louisiana 518733 506000 498542 501000 17 Colorado 484902 459000 550390 509000 18 Michigan 424759 447000 494554 428000 19 Virginia 421000 440000 494554 529000 20 Maryland 375893 428000 311090 408000 21 Ohio 390929 416000 422764 448000 22 Tennessee 390929 409000 390857 372000 23 Oregon 289000 331000 307102 323000 24 Connecticut 323268 303000 291149 323000 25 South Carolina 226000 288000 231323 246000 26 Minnesota 248000 261000 283172 287000 27 Wyoming 229000 249000 199417 246000 28 Wisconsin 177000 210000 243289 234000 29 Missouri 211000 202000 215370 170000 30 Indiana 207000 195000 203405 226000 31 Kentucky 113000 144000 107685 97000 32 Alabama 124000 136000 155545 141000 33 Maine 124000 109000 143580 149000 34 New Mexico 117000 86000 131615 153000 35 New Hampshire NaN NaN 155545 105000 36 Rhode Island NaN NaN 139592 113000 37 Alaska NaN NaN 135603 109000 38 Oklahoma NaN NaN 103697 101000 39 lowa NaN NaN NaN 105000 : state visitation 2016 visitation 2017 visitation 2018 visitation_2019 0 New York 1.00138e+07 10287000 1.08044e+07 10518000 1 Florida 9.54017e+06 9481000 9.37658e +06 9610000 2 California 8.22078e +06 8178000 8.53105e+06 8050000 3 Hawaiian Islands 3.14623e+06 3319000 3.18269e+06 3296000 4 Nevada 3.41687e+06 3023000 3.24252e+06 3058000 5 Massachusetts 1.64265e+06 1817000 1.83464e +06 1745000 6 Texas 1.69152e+06 1739000 1.93833e+06 1745000 7 Guam 1.58251e+06 1681000 1.61528e+06 1842000 8 Illinois 1.56747e+06 1638000 1.61926e+06 1555000 9 New Jersey 1.10513e+06 1093000 1.10876e+06 1159000 10 Arizona 1.15775e+06 1035000 1.16858e+06 1196000 11 Pennsylvania 973563 1004000 1.01304e+06 1054000 12 Georgia 875831 879000 837551 868000 13 Washington 729233 798000 797667 925000 14 Utah 642777 634000 717900 739000 15 North Carolina 436036 525000 546402 452000 16 Louisiana 518733 506000 498542 501000 17 Colorado 484902 459000 550390 509000 18 Michigan 424759 447000 494554 428000 19 Virginia 421000 440000 494554 529000 20 Maryland 375893 428000 311090 408000 21 Ohio 390929 416000 422764 448000 22 Tennessee 390929 409000 390857 372000 23 Oregon 289000 331000 307102 323000 24 Connecticut 323268 303000 291149 323000 25 South Carolina 226000 288000 231323 246000 26 Minnesota 248000 261000 283172 287000 27 Wyoming 229000 249000 199417 246000 28 Wisconsin 177000 210000 243289 234000 29 Missouri 211000 202000 215370 170000 30 Indiana 207000 195000 203405 226000 31 Kentucky 113000 144000 107685 97000 32 Alabama 124000 136000 155545 141000 33 Maine 124000 109000 143580 149000 34 New Mexico 117000 86000 131615 153000 35 New Hampshire NaN NaN 155545 105000 36 Rhode Island NaN NaN 139592 113000 37 Alaska NaN NaN 135603 109000 38 Oklahoma NaN NaN 103697 101000 39 lowa NaN NaN NaN 105000
Step by Step Solution
There are 3 Steps involved in it
Step: 1

Get Instant Access to Expert-Tailored Solutions
See step-by-step solutions with expert insights and AI powered tools for academic success
Step: 2

Step: 3
Ace Your Homework with AI
Get the answers you need in no time with our AI-driven, step-by-step assistance
Get Started