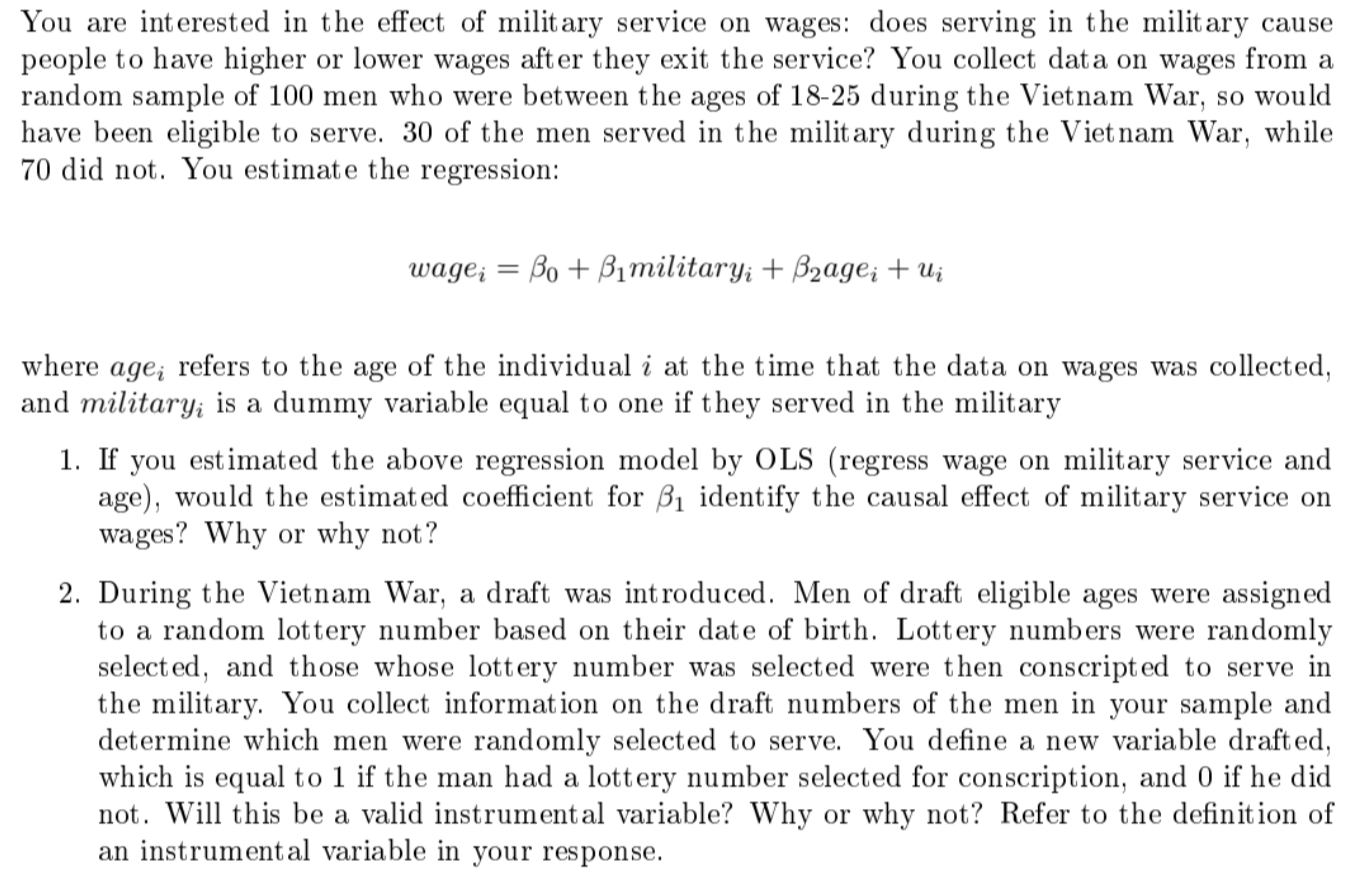

You are interested in the effect of military service on wages: does serving in the military cause people to have higher or lower wages after they exit the service? You collect data on wages from a random sample of 100 men who were between the ages of 18-25 during the Vietnam War, so would have been eligible to serve. 30 of the men served in the military during the Vietnam War, while 70 did not. You estimate the regression: wagei=0+1militaryi+2agei+ui where agei refers to the age of the individual i at the time that the data on wages was collected, and military i is a dummy variable equal to one if they served in the military 1. If you estimated the above regression model by OLS (regress wage on military service and age), would the estimated coefficient for 1 identify the causal effect of military service on wages? Why or why not? 2. During the Vietnam War, a draft was introduced. Men of draft eligible ages were assigned to a random lottery number based on their date of birth. Lottery numbers were randomly selected, and those whose lottery number was selected were then conscripted to serve in the military. You collect information on the draft numbers of the men in your sample and determine which men were randomly selected to serve. You define a new variable drafted, which is equal to 1 if the man had a lottery number selected for conscription, and 0 if he did not. Will this be a valid instrumental variable? Why or why not? Refer to the definition of an instrumental variable in your response. 3. If you use this as an instrumental variable, describe the effect that you are estimating, using the concept of a "local average treatment effect". 4. You want to test whether this is a strong instrument, so you run the two regressions as shown in Figure 1. Is the instrument strong? Why or why not? 5. You collect data from an additional 4900 men and run the two regressions as shown in Figure 2. On this sample, is the instrument strong? Explain. You are interested in the effect of military service on wages: does serving in the military cause people to have higher or lower wages after they exit the service? You collect data on wages from a random sample of 100 men who were between the ages of 18-25 during the Vietnam War, so would have been eligible to serve. 30 of the men served in the military during the Vietnam War, while 70 did not. You estimate the regression: wagei=0+1militaryi+2agei+ui where agei refers to the age of the individual i at the time that the data on wages was collected, and military i is a dummy variable equal to one if they served in the military 1. If you estimated the above regression model by OLS (regress wage on military service and age), would the estimated coefficient for 1 identify the causal effect of military service on wages? Why or why not? 2. During the Vietnam War, a draft was introduced. Men of draft eligible ages were assigned to a random lottery number based on their date of birth. Lottery numbers were randomly selected, and those whose lottery number was selected were then conscripted to serve in the military. You collect information on the draft numbers of the men in your sample and determine which men were randomly selected to serve. You define a new variable drafted, which is equal to 1 if the man had a lottery number selected for conscription, and 0 if he did not. Will this be a valid instrumental variable? Why or why not? Refer to the definition of an instrumental variable in your response. 3. If you use this as an instrumental variable, describe the effect that you are estimating, using the concept of a "local average treatment effect". 4. You want to test whether this is a strong instrument, so you run the two regressions as shown in Figure 1. Is the instrument strong? Why or why not? 5. You collect data from an additional 4900 men and run the two regressions as shown in Figure 2. On this sample, is the instrument strong? Explain


