

Answered step by step
Verified Expert Solution
Question
1 Approved Answer
You are looking to invest your money in Stock ABC and Stock XYZ. Their historical returns for the past 6 years are found in
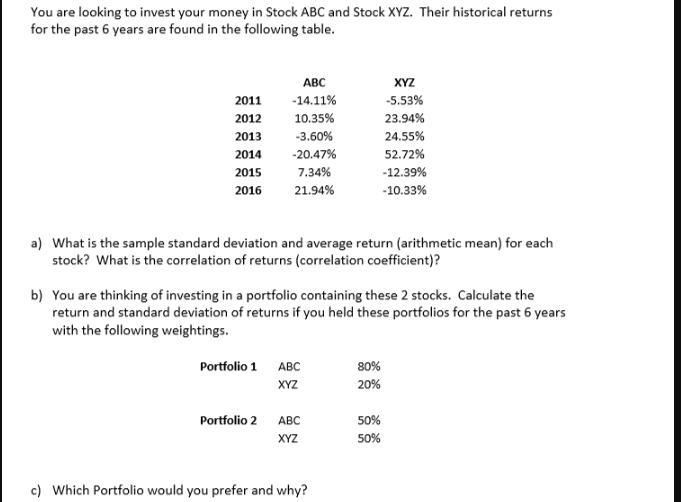
You are looking to invest your money in Stock ABC and Stock XYZ. Their historical returns for the past 6 years are found in the following table. ABC XYZ 2011 -14.11% -5.53% 2012 10.35% 23.94% 2013 -3.60% 24.55% 2014 -20.47% 52.72% 2015 7.34% -12.39% 2016 21.94% -10.33% a) What is the sample standard deviation and average return (arithmetic mean) for each stock? What is the correlation of returns (correlation coefficient)? b) You are thinking of investing in a portfolio containing these 2 stocks. Calculate the return and standard deviation of returns if you held these portfolios for the past 6 years with the following weightings. Portfolio 1 ABC 80% XYZ 20% Portfolio 2 ABC 50% XYZ 50% c) Which Portfolio would you prefer and why?
Step by Step Solution
There are 3 Steps involved in it
Step: 1
a Sample Standard Deviation Average Return and Correlation Coefficient First well calculate the sample standard deviation and average return for each ...
Get Instant Access to Expert-Tailored Solutions
See step-by-step solutions with expert insights and AI powered tools for academic success
Step: 2

Step: 3
Ace Your Homework with AI
Get the answers you need in no time with our AI-driven, step-by-step assistance
Get Started
Financial Analysis with Microsoft Excel
Authors: Timothy R. Mayes, Todd M. Shank
7th edition
1285432274, 978-1305535596, 1305535596, 978-1285432274