Answered step by step
Verified Expert Solution
Link Copied!

Question

1 Approved Answer

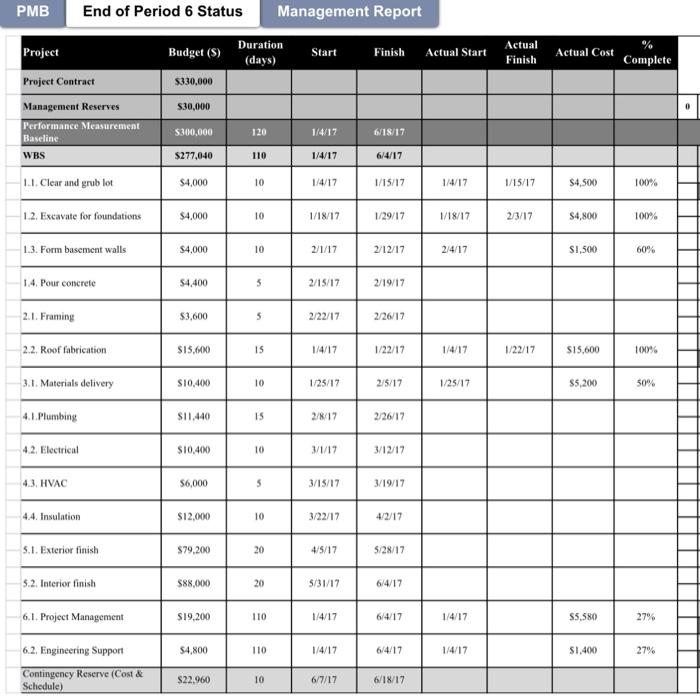
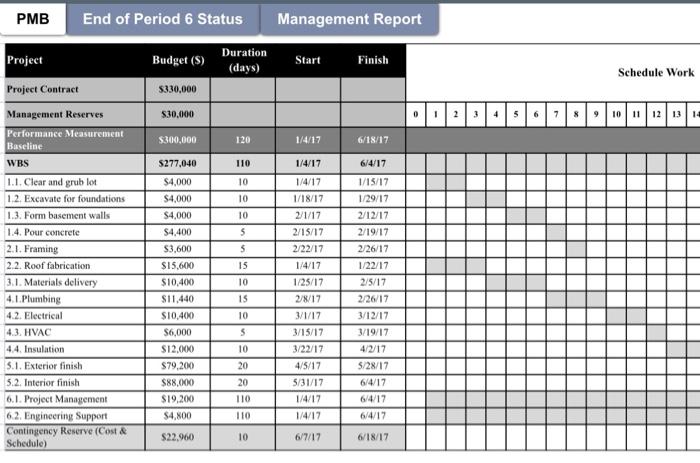
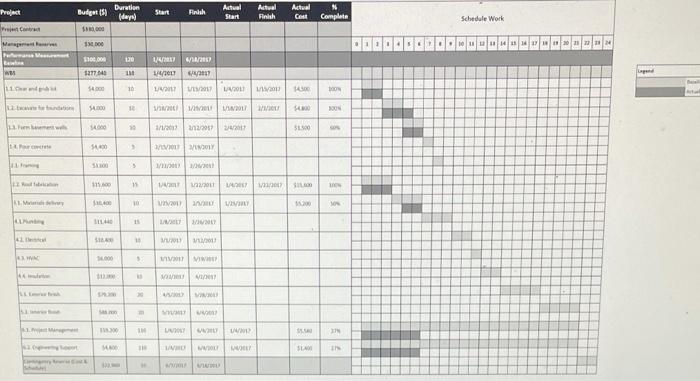
You are managing a construction project. Management has asked you to provide detailed project status and analysis using EVM. You decided to use the attached

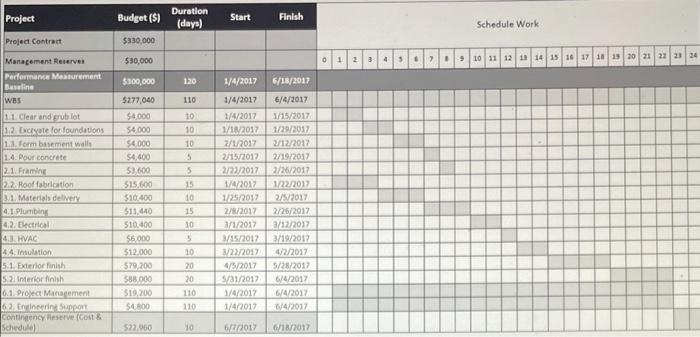
image text in transcribed
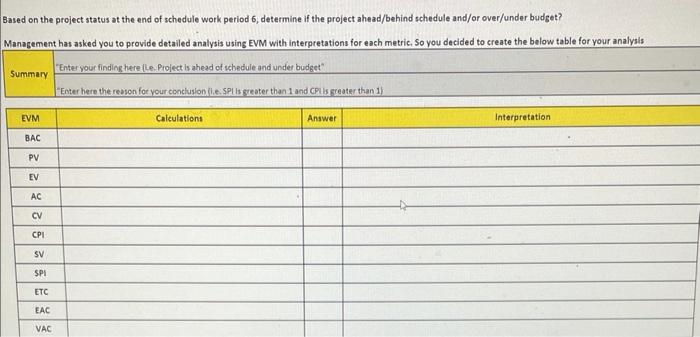
You are managing a construction project. Management has asked you to provide detailed project status and analysis using EVM. You decided to use the attached excel sheet to developed the EVM report. Please be advised that the excel sheet contains three worksheets: - PMB (performance measurement baseline) which is your original plan (baseline) - End of period 6 status which is a record of actual schedule and actual cost performance. - Management report which what you will use as a report for EVM calculation. You will need fill out the table, and the summary line. 3ased on the project status at the end of schedule work period 6 , determine if the project ahead/behind schedule and/or over/under budget? Management has asked you to provide detailed analysis using EVM with interpretations for each metric, So you decided to create the below table for your analysis You are managing a construction project. Management has asked you to provide detailed project status and analysis using EVM. You decided to use the attached excel sheet to developed the EVM report. Please be advised that the excel sheet contains three worksheets: - PMB (performance measurement baseline) which is your original plan (baseline) - End of period 6 status which is a record of actual schedule and actual cost performance. - Management report which what you will use as a report for EVM calculation. You will need fill out the table, and the summary line. 3ased on the project status at the end of schedule work period 6 , determine if the project ahead/behind schedule and/or over/under budget? Management has asked you to provide detailed analysis using EVM with interpretations for each metric, So you decided to create the below table for your analysis
Step by Step Solution

There are 3 Steps involved in it

Step: 1

blur-text-image

Get Instant Access to Expert-Tailored Solutions

See step-by-step solutions with expert insights and AI powered tools for academic success

Step: 2

blur-text-image

Step: 3

blur-text-image

Ace Your Homework with AI

Get the answers you need in no time with our AI-driven, step-by-step assistance

Get Started

Recommended Textbook for

The Social Media Handbook For Financial Advisors

Authors: Matthew Halloran

1st Edition

1118208013, 978-1118208014

More Books

Students also viewed these Finance questions