You are performing a study about weekly per capita milk consumption. A previous study found weekly per capita milk consumption to be normally distributed, with
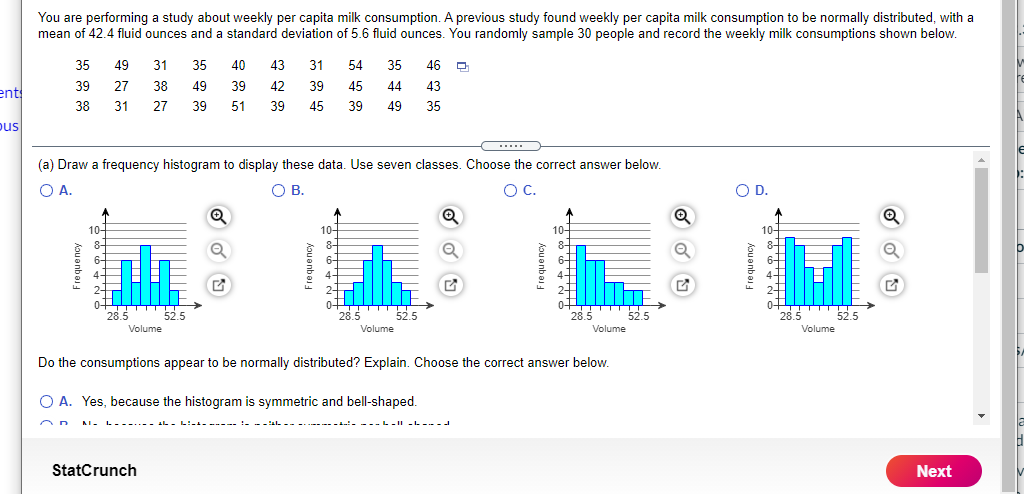
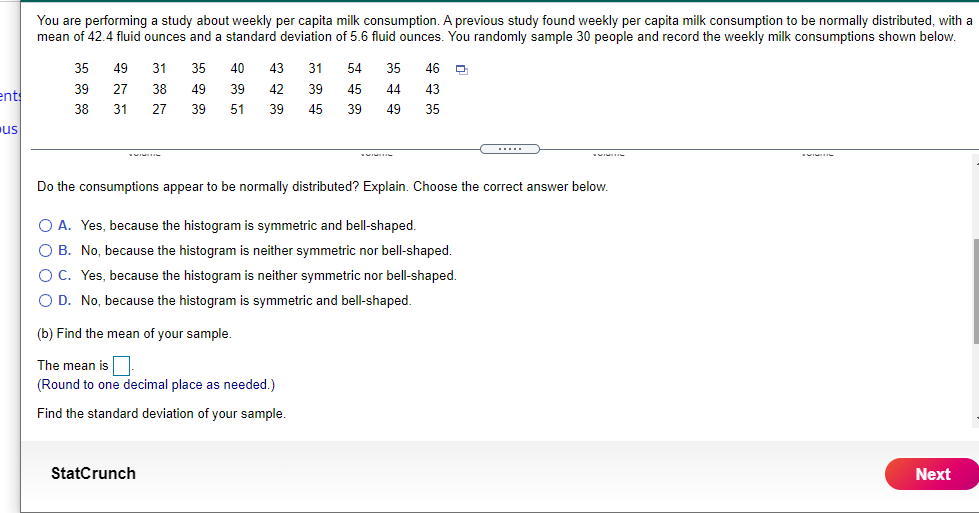
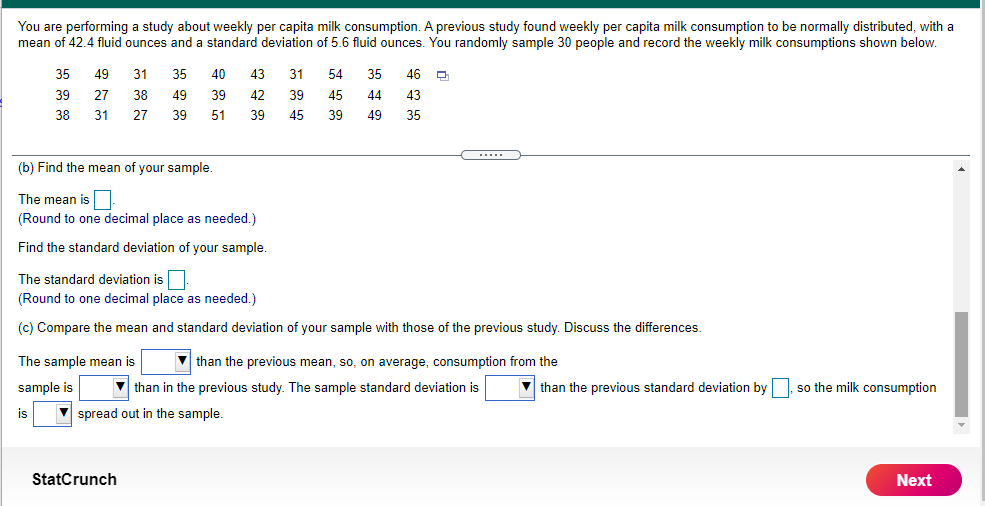
You are performing a study about weekly per capita milk consumption. A previous study found weekly per capita milk consumption to be normally distributed, with a mean of 42.4 fluid ounces and a standard deviation of 5.6 fluid ounces. You randomly sample 30 people and record the weekly milk consumptions shown below. 35 49 31 35 40 43 31 54 35 460 ent 39 27 38 49 39 42 39 45 44 43 38 31 27 39 51 39 45 39 49 35 us . . . . . (a) Draw a frequency histogram to display these data. Use seven classes. Choose the correct answer below. O A. O B. O C. OD. O 10- Frequency Frequency Frequency Frequency 28.5 52.5 28.5 52.5 28.5 52.5 52.5 Volume Volume Volume Volume Do the consumptions appear to be normally distributed? Explain. Choose the correct answer below. O A. Yes, because the histogram is symmetric and bell-shaped. An N. L.- - L - II - L -.. StatCrunch NextYou are performing a study about weekly per capita milk consumption. A previous study found weekly per capita milk consumption to be normally distributed, with a mean of 42.4 uid ounces and a standard deviation oi 5.6 uid ounces. You randomly sample 30 people and record the weekly milk consumptions shown below. 35 49 31 35 4D 43 31 54 35 46 % 39 2? 3B 49 39 42 39 45 44 43 3B 31 2? 39 51 39 45 39 49 35 ( ..... Do the consumptions appear to be normally distributed? Explain. Choose the correct answer below. CI A. Yes. because the histogram is symmetric and bellshaped. CI B. No, because the histogram is neither symmetric nor bellshaped. Cl C. Yes. because the histogram is neither symmetric nor bellshaped. CI D. No, because the histogram is symmetric and bellshaped. (b) Find the mean of your sample. The mean is . (Round to one decimal place as needed.) Find the standard deviation of your sample. W... m You are performing a study about weekly per capita milk consumption. A previous study found weekly per capita milk consumption to be normally distributed. with a mean of 42.4 uid ounces and a standard deviation of 5.6 uid ounces. You randomly sample 30 people and record the weekly milk consumptions shown below. 35 49 31 35 4t] 43 39 27 3B 49 39 42 3B 31 2? 39 51 39 31 54- 35 46 lg. 39 45 44 43 45 39 49 35 (b) Find the mean of your sample. The mean is :|. (Round to one decimal place as needed.) Find the standard deviation oi your sample. The standard deviation is (Round to one decimal place as needed.) {o} Compare the mean and standard deviation of your sample with those of the previous study. Discuss the dilt'erenoes. The sample mean is E than the previous mean, so, on average, consumption from the sample is E than in the previous study. The sample standard deviation is E than the previous standard deviation by D so the milk consumption is E spread out in the sample. StatCrunch
Step by Step Solution
There are 3 Steps involved in it
Step: 1
Get Instant Access to Expert-Tailored Solutions
See step-by-step solutions with expert insights and AI powered tools for academic success
Step: 2
Step: 3
Ace Your Homework with AI
Get the answers you need in no time with our AI-driven, step-by-step assistance