You are provided with the reformulated financial statements for Woolworths during 2008-2017. You are required to complete the following tasks:
(1) Detailed profitability analysis for the years 2008-2017, including the following decompositions: (i) ROCE = OI/CSE - NFE/CSE - MIE/MI, (ii) ROCE = RNOA + FLEV x Spread + MILEV + MISpread, (iii) RNOA = ROOA + OLLEV + Spread (assuming short term borrowing rate for 90 day bills of 2.4%), (iv) RNOA = AT + OPM, (v) OPM = GPM - ER, (vi) calculation of the cash-to-cash cycle. Comment on how financial ratios move over time and which indicators define the changing profitability of Woolworths.
(2) Assume that you are in 2008 and the reformulated statements are excellent forecasts (in fact they are perfect forecasts!). Note that the price of Woolworths as at year end 2008 was $24.95. Use the residual income valuation (RIV) model to value the equity of Woolworths as at 2008 assuming cost of equity capital of 8% and growth in residual income of 1.5%. Comment on your findings and the intrinsic value. Find the implied growth, and the implied cost of equity capital.
(3) Again assume that you are in 2008 and the reformulated statements are excellent forecasts. Note again that the price of Woolworths as at year end 2008 was $24.95. Use the residual operating income valuation model (ReOI) to value the equity of Woolworths as at 2008. Calculate the cost of operations using the Weighted Average Cost of Capital (WACC) , as described in pages 445-448 of the Penman textbook. Assuming again cost of equity capital of 8% and growth in residual operating income of 1%. The nominal cost of debt for Woolworths in 2008 was 5.85% and the marginal tax rate 30%. Comment on your findings and the intrinsic value. Find the implied growth, and the implied cost of equity capital.
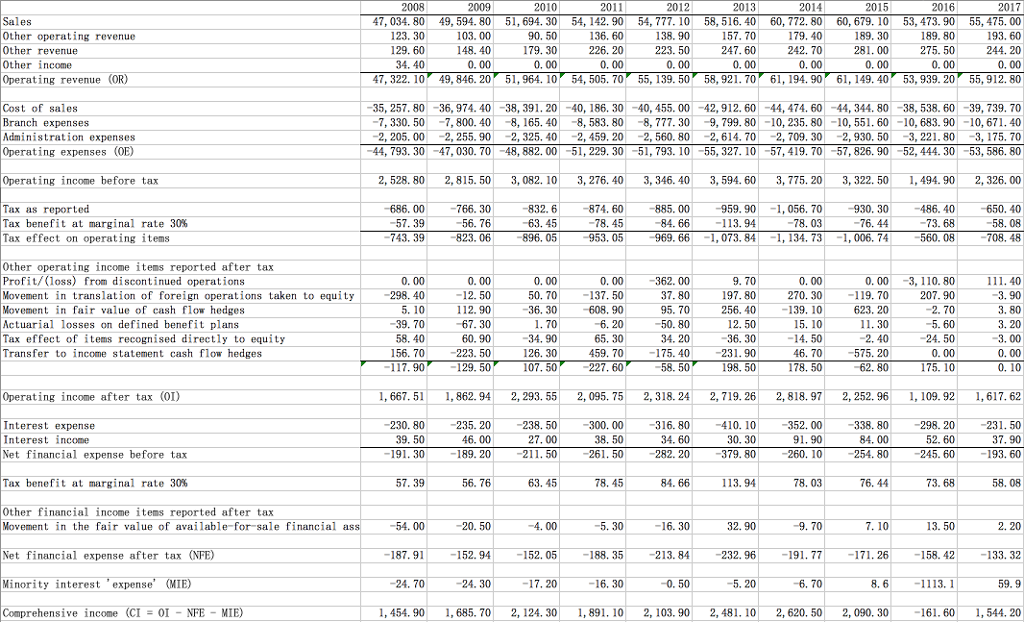
2017 2014 60, 772. 80 179. 40 242. 70 2008 2009 2012 2016 Other operating revenue Other revenue Other income Operating revenue (OR) 7,034.80 123. 30 49,594.8051,694. 3054, 142. 9054, 777.1058, 516. 40 157. 70 103.00 -- 179.30 148. 40 138. 90 223. 50 60, 679. 1053, 473.9055, 475.00 193. 60 244. 20 189. 80 275. 50 136. 60 226. 20 129. 60 47, 322. 10, 49, 846. 20, 51, 964. 10' 54, 505. 70, 55, 139. 50, 58, 921. 70' 6194.90' 61, 149. 40, 53, 939. 20' 55, 912. 80 ost of Sales Branch expenses Administration expenses 35, 257. 80 -36,974.40 -38, 391.20 -40, 186. 30-40, 455. 00-42, 912. 60 -44, 474.60 -44, 344. 80-38, 538.60 -39, 739.70 7, 330.507,800.408, 165. 40-8, 583. 808, 777. 309, 799.80-10, 235. 8010, 551. 60-10, 683. 90 -10, 671.40 2, 205. 002,255.902, 325, 402, 459, 20 2, 560. 802, 614.702, 709, 302, 930.503, 221.803, 175. 70 44, 793. 30-47, 030. 70-48, 882. 005, 229. 3051, 793. 10-55, 327.1057,419. 7057, 826. 9052, 444. 30 53, 586. 80 Operating expenses Operating income before tax 2, 528. 80 2,815. 50 3, 082. 10 3, 276.40 3, 346. 40 3, 594.60 3,775. 20 3,322. 50 1,494.90 2, 326. 00 Tax as reported Tax benefit at marginal rate 30% Tax effect on operating items 686. 00766. 30 56. 76 823. 06 -832. 6 -63. 45 896. 05 874. 60-885. 00959. 901, 056. 70930. 30486. 40650. 40 58. 08 708. 48 84. 66 969. 66-1,073. 84, 134. 73-1, 006. 74 73. 68 560. 08 953. 05 Other operating income items reported after tax Profit/(loss) from discontinued operations Movement in translation of foreign operations taken to equity Movement in fair value of cash flow hedges Actuarial losses on defined benefit plans Tax effect of items recognised directly to equity Transfer to income statement cash flow hedges 0.00 -119. 70 623. 20 3, 110. 80 207.90 362. 00 298. 40 50. 70137. 50 36, 30608, 90 6.20 137.505.7012. 50 270. 30 256, 40139. 10 15. 10 5.102. 50 58.4067. 30 156. 70 50. 80 5.60 60.90126.30 459. 7034. 20 175. 40 65, 30 575. 20 198. 50 62. 80 2,719. 262,818.972, 252.96 338. 80 254. 80 76. 44 129 107 58. 50 Operating income after tax (OI) 1,667.51 109. 92 298. 20 245. 60 73. 68 1, 862.942,293. 55 2, 095. 752, 318. 24 300. 00 235. 20 46. 00 316.80410. 10 352. 00 Interest expense Interest income Net financial expense before tax 230. 80 238. 50 27. 00 52623 37. 90 193. 60 282. 20 260. 10 Tax benefit at marginal rate 30% 58. 08 Other financial income items reported after tax Movement in the fair value of available for sale financial ass 4. 00 -16. 30 32. 90 152.94 842 Net financial expense after tax (NFE) Minority interest expense MIE) Comprehensive income (CI 0I NFE MIE) 187 -152. 05188. 35213. 232.96191.77-171. 26158. 42-133. 32 1,454.90 1,685. 70 2,124. 30 . ?891.10 2,103. 90 2,481.10 2,620. 50 2,090, 30--161.60 1,544. 20 2017 2014 60, 772. 80 179. 40 242. 70 2008 2009 2012 2016 Other operating revenue Other revenue Other income Operating revenue (OR) 7,034.80 123. 30 49,594.8051,694. 3054, 142. 9054, 777.1058, 516. 40 157. 70 103.00 -- 179.30 148. 40 138. 90 223. 50 60, 679. 1053, 473.9055, 475.00 193. 60 244. 20 189. 80 275. 50 136. 60 226. 20 129. 60 47, 322. 10, 49, 846. 20, 51, 964. 10' 54, 505. 70, 55, 139. 50, 58, 921. 70' 6194.90' 61, 149. 40, 53, 939. 20' 55, 912. 80 ost of Sales Branch expenses Administration expenses 35, 257. 80 -36,974.40 -38, 391.20 -40, 186. 30-40, 455. 00-42, 912. 60 -44, 474.60 -44, 344. 80-38, 538.60 -39, 739.70 7, 330.507,800.408, 165. 40-8, 583. 808, 777. 309, 799.80-10, 235. 8010, 551. 60-10, 683. 90 -10, 671.40 2, 205. 002,255.902, 325, 402, 459, 20 2, 560. 802, 614.702, 709, 302, 930.503, 221.803, 175. 70 44, 793. 30-47, 030. 70-48, 882. 005, 229. 3051, 793. 10-55, 327.1057,419. 7057, 826. 9052, 444. 30 53, 586. 80 Operating expenses Operating income before tax 2, 528. 80 2,815. 50 3, 082. 10 3, 276.40 3, 346. 40 3, 594.60 3,775. 20 3,322. 50 1,494.90 2, 326. 00 Tax as reported Tax benefit at marginal rate 30% Tax effect on operating items 686. 00766. 30 56. 76 823. 06 -832. 6 -63. 45 896. 05 874. 60-885. 00959. 901, 056. 70930. 30486. 40650. 40 58. 08 708. 48 84. 66 969. 66-1,073. 84, 134. 73-1, 006. 74 73. 68 560. 08 953. 05 Other operating income items reported after tax Profit/(loss) from discontinued operations Movement in translation of foreign operations taken to equity Movement in fair value of cash flow hedges Actuarial losses on defined benefit plans Tax effect of items recognised directly to equity Transfer to income statement cash flow hedges 0.00 -119. 70 623. 20 3, 110. 80 207.90 362. 00 298. 40 50. 70137. 50 36, 30608, 90 6.20 137.505.7012. 50 270. 30 256, 40139. 10 15. 10 5.102. 50 58.4067. 30 156. 70 50. 80 5.60 60.90126.30 459. 7034. 20 175. 40 65, 30 575. 20 198. 50 62. 80 2,719. 262,818.972, 252.96 338. 80 254. 80 76. 44 129 107 58. 50 Operating income after tax (OI) 1,667.51 109. 92 298. 20 245. 60 73. 68 1, 862.942,293. 55 2, 095. 752, 318. 24 300. 00 235. 20 46. 00 316.80410. 10 352. 00 Interest expense Interest income Net financial expense before tax 230. 80 238. 50 27. 00 52623 37. 90 193. 60 282. 20 260. 10 Tax benefit at marginal rate 30% 58. 08 Other financial income items reported after tax Movement in the fair value of available for sale financial ass 4. 00 -16. 30 32. 90 152.94 842 Net financial expense after tax (NFE) Minority interest expense MIE) Comprehensive income (CI 0I NFE MIE) 187 -152. 05188. 35213. 232.96191.77-171. 26158. 42-133. 32 1,454.90 1,685. 70 2,124. 30 . ?891.10 2,103. 90 2,481.10 2,620. 50 2,090, 30--161.60 1,544. 20