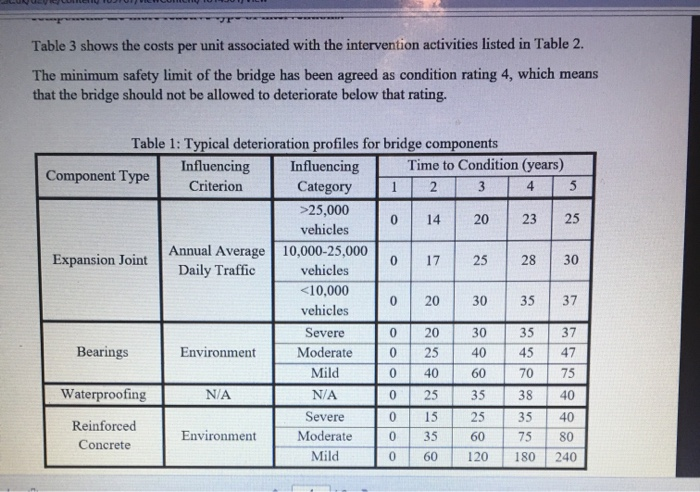
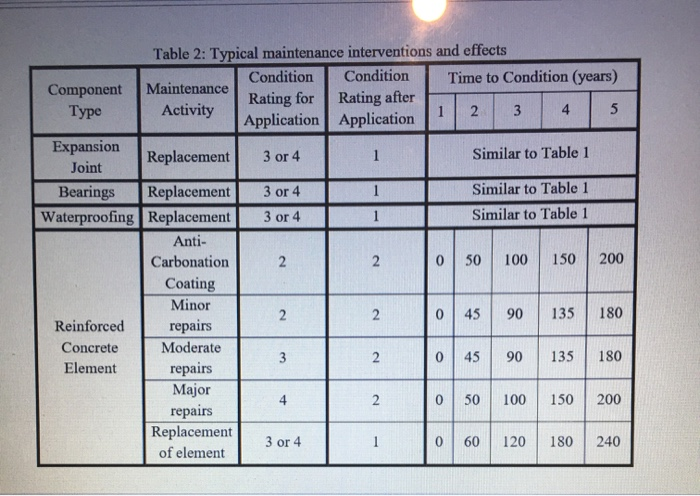
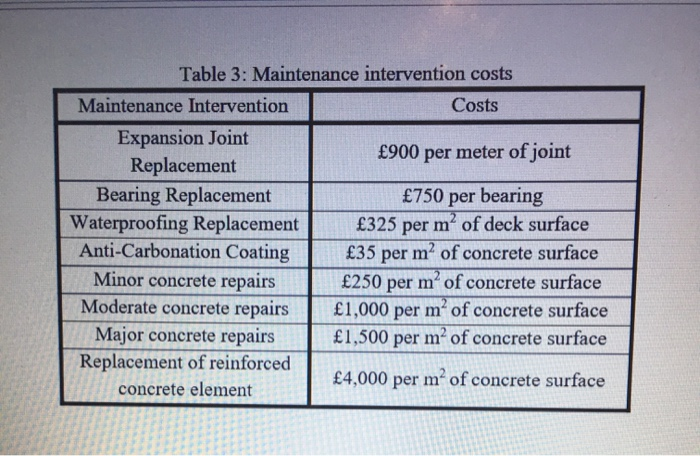
You are responsible for the asset management of a new, single-span, reinforced concrete bridge that has just been constructed and you are required to develop long-term maintenance plans for this bridge using whole-life analysis. The total concrete surface area of bridge is 460 mand total deck surface area is equal to 120 m. The total length of the expansion joints at each end of the bridge is 20 meters. The annual average daily traffic (AADT) experienced by the structure is 36,000 vehicles, which includes a high proportion of heavy goods vehicles. The bridge is located in a severe exposure environment, close to the sea coast. The bridge rests on a total of four bearings Table 1 shows typical deterioration profiles for a number of bridge components that you need to consider in your analysis. The profiles in Table 1 are defined in terms of the condition rating (between 1 to 5, where I refers to the best and 5 refers to the worst condition) and show the number of years required for condition to drop from one rating to the next one, due to deterioration. The influencing criteria that affect the deterioration rate for different components are also shown in the table. Table 2 shows different intervention options for the components listed in Table 1. It shows at which condition ratings each intervention can be applied and also what will be the effect of intervention, following its application, on the condition rating. The anti-carbonation coating is a preventative maintenance intervention which aims at slowing down the rate of deterioration of the concrete. The concrete repairs (minor, moderate, major) and the replacement of bridge components are more reactive type of interventions. Table 3 shows the costs per unit associated with the intervention activities listed in Table 2. The minimum safety limit of the bridge has been agreed as condition rating 4, which means 4 16 Table 3 shows the costs per unit associated with the intervention activities listed in Table 2. The minimum safety limit of the bridge has been agreed as condition rating 4, which means that the bridge should not be allowed to deteriorate below that rating. Table 1: Typical deterioration profiles for bridge components Influencing Influencing Time to Condition (years) Component Type Criterion Category 2 4 5 >25,000 0 14 20 23 25 vehicles Expansion Joint Annual Average 10,000-25,000 0 17 25 28 30 Daily Traffic vehicles 25,000 0 14 20 23 25 vehicles Expansion Joint Annual Average 10,000-25,000 0 17 25 28 30 Daily Traffic vehicles