

Answered step by step
Verified Expert Solution
Question
1 Approved Answer
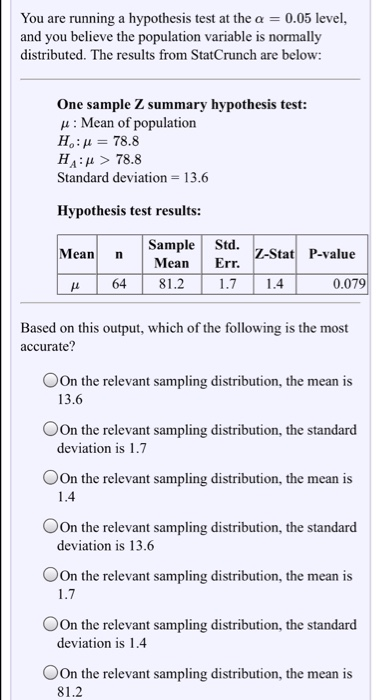
You are running a hypothesis test at the a = 0.05 level, and you believe the population variable is normally distributed. The results from StatCrunch
Step by Step Solution
There are 3 Steps involved in it
Step: 1

Get Instant Access to Expert-Tailored Solutions
See step-by-step solutions with expert insights and AI powered tools for academic success
Step: 2

Step: 3
Ace Your Homework with AI
Get the answers you need in no time with our AI-driven, step-by-step assistance
Get Started
Differential Equations For Engineers
Authors: Wei Chau Xie
1st Edition
0511771037, 9780511771033