 You are starting a business that manages camping sites, and you have $2,000 of equity. Create a simple balance sheet and income statement for the first 2 years of business. The images are just for reference.
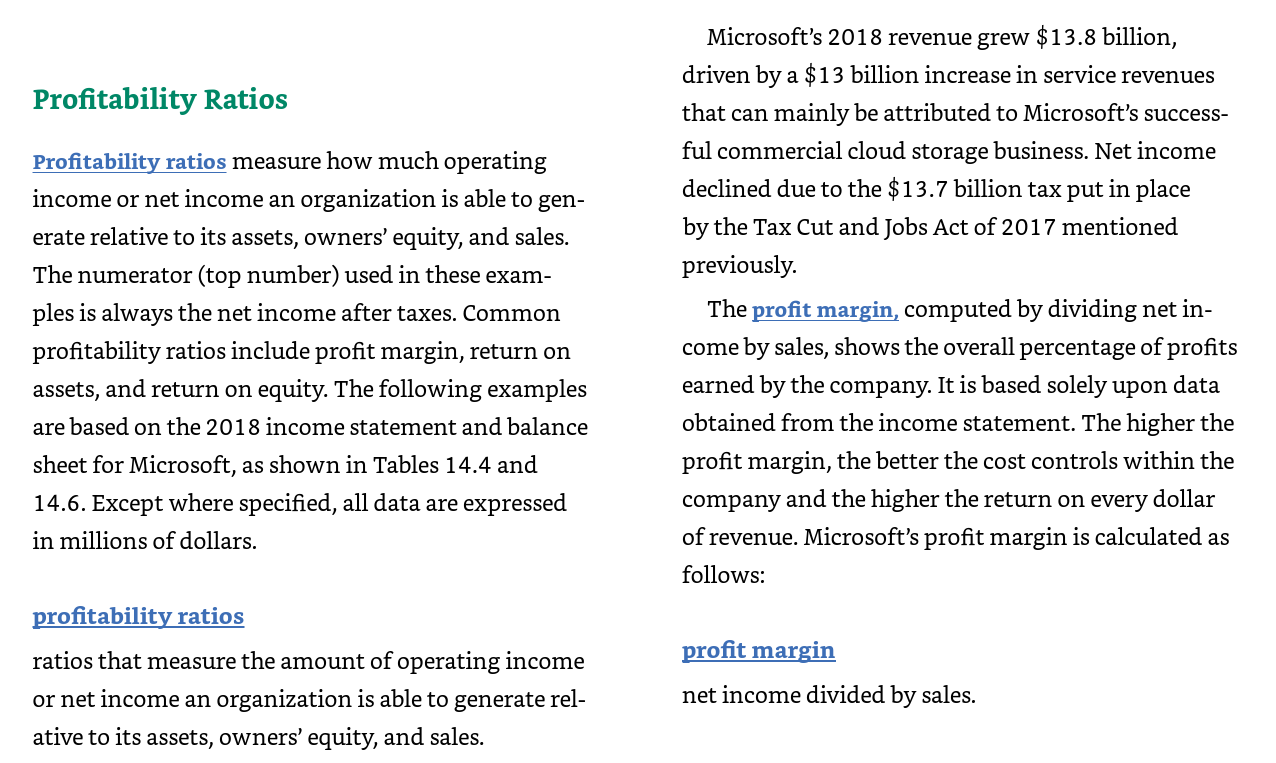
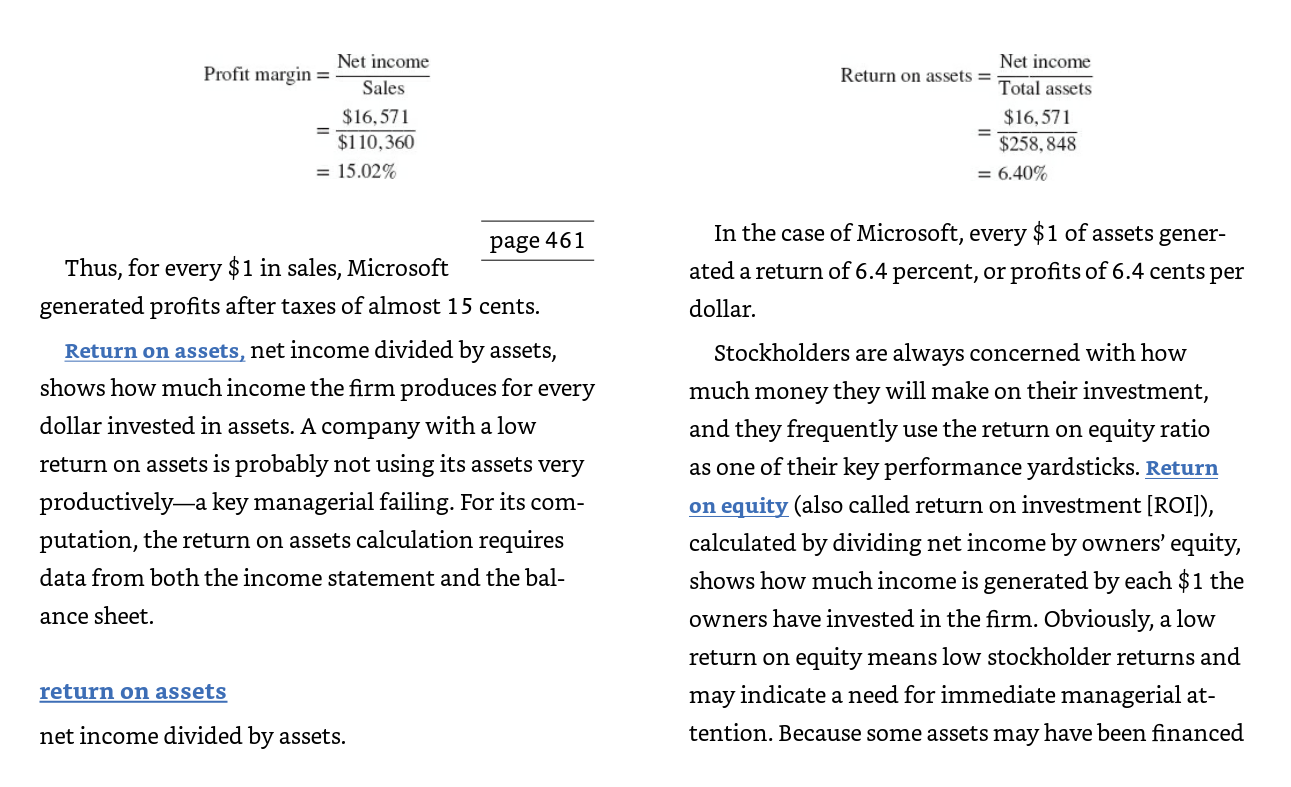
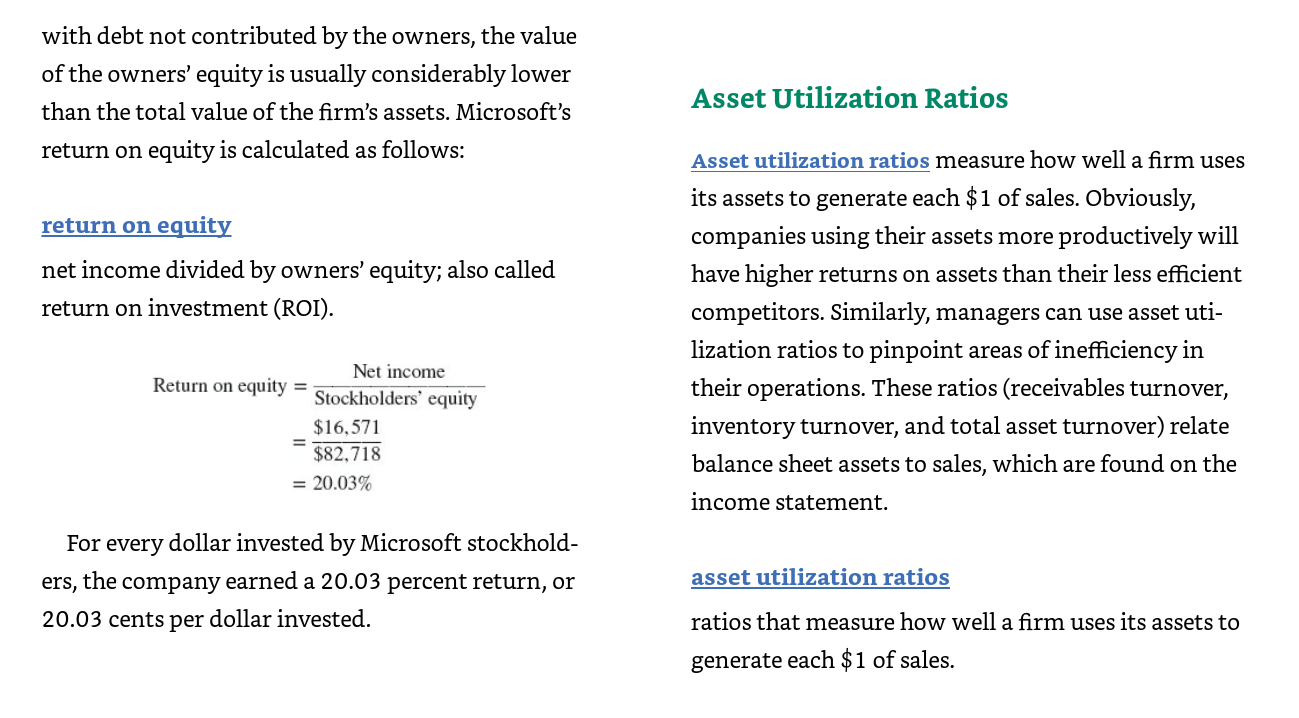
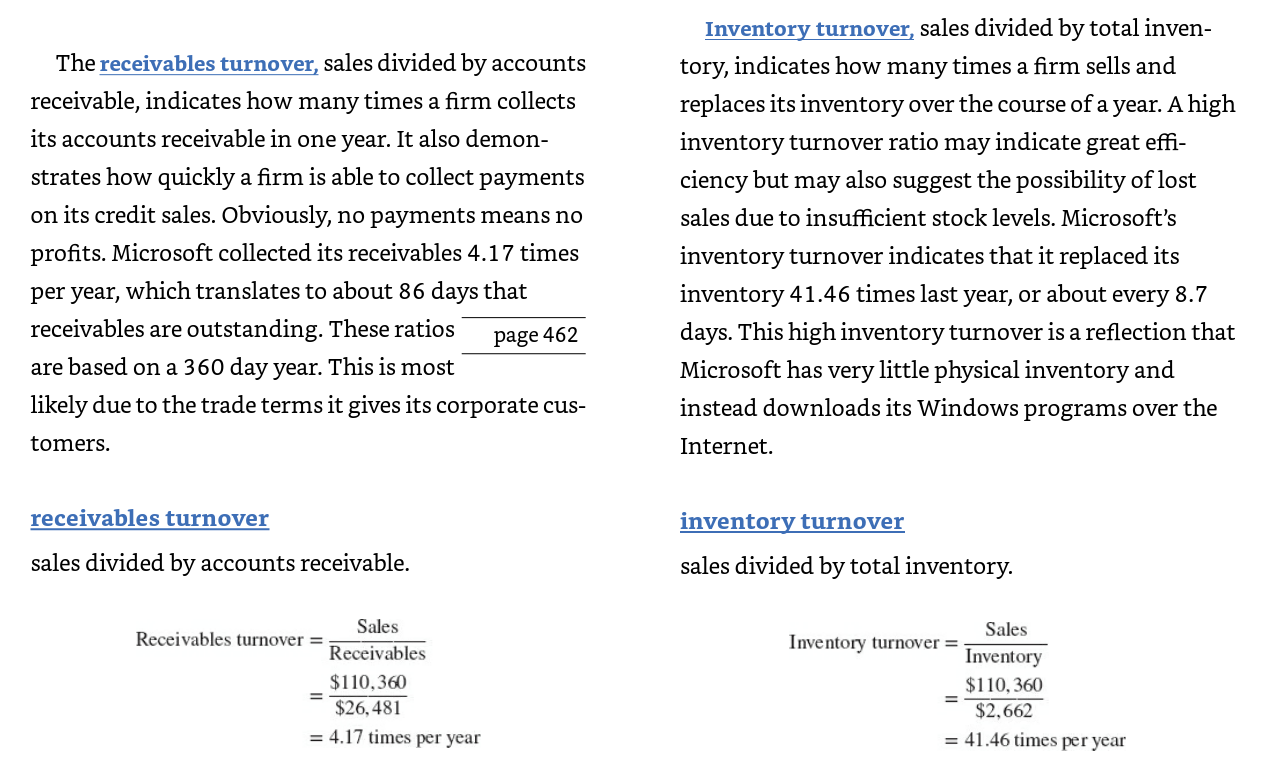
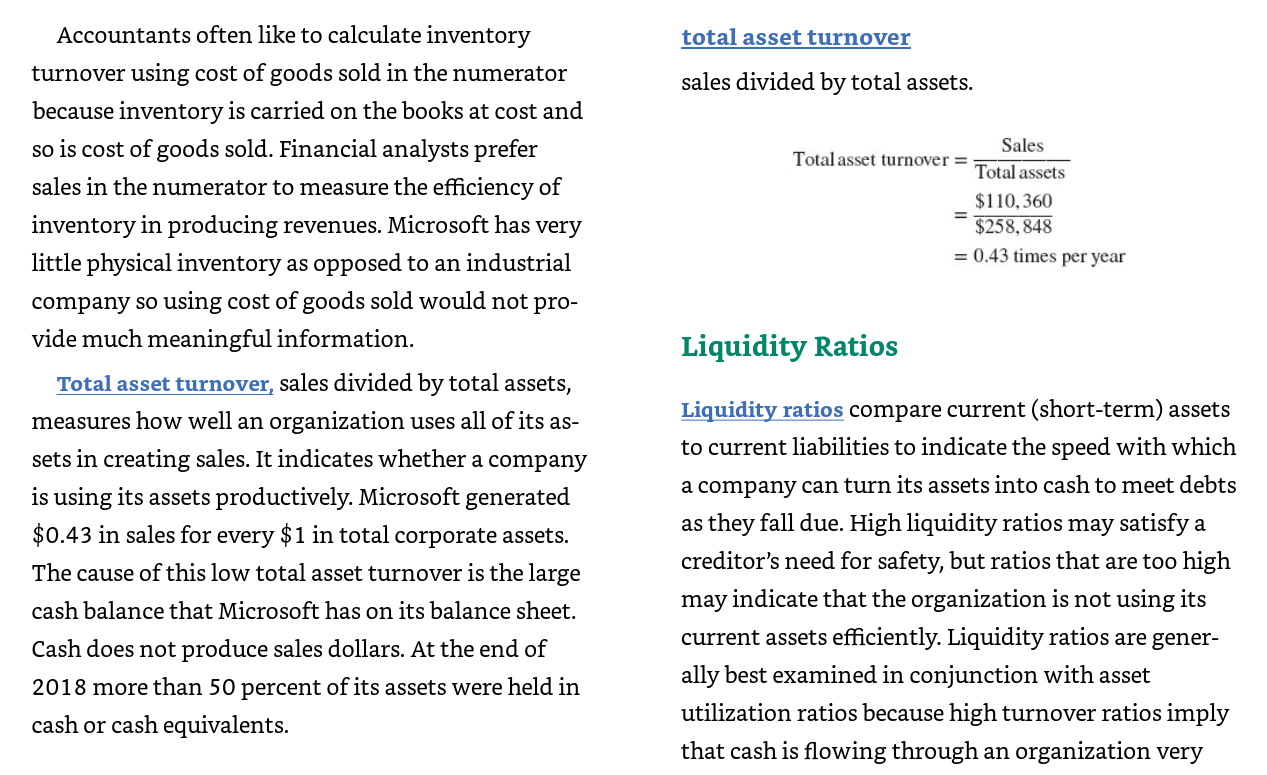
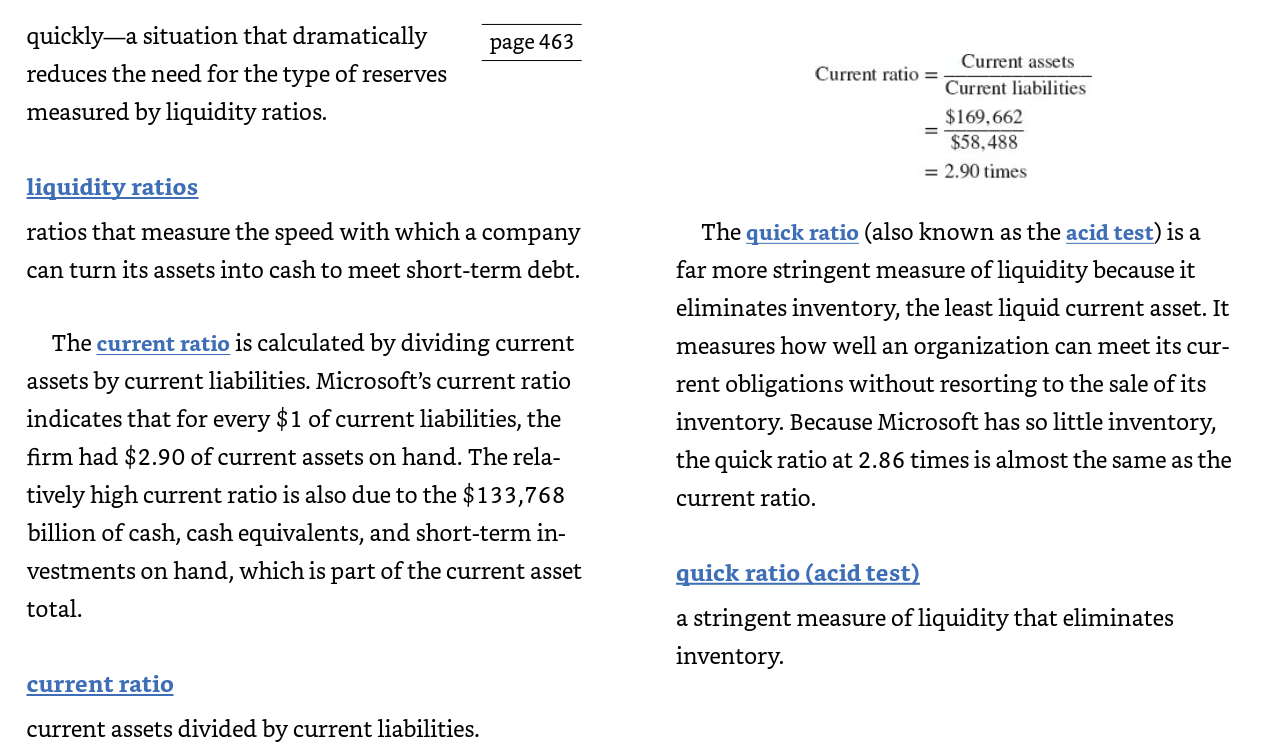
Cash from financing activities is calcu- lated from changes in the long-term liability accounts and the contributed capital accounts in owners' equity. If this amount is negative, the com- pany is likely paying off long-term debt or returning contributed capital to investors. In the case of Micro- soft, it sold debt and repurchased $10.721 billion of its own stock and paid dividends of $12.699 billion, which resulted in a negative $33.590 billion cash flow from financing. Finally, cash from investing activities is calculated from changes in the long-term or fixed asset ac- Ratio Analysis: Analyzing Financial Statements counts. If this amount is negative, as is the case with Microsoft, we can see that the company bought $11.632 billion of property and equipment. It also purchased $137.380 billion of investments and sold $117.577 billion of investments and had $26.360 billion of investments mature for a total negative cash flow of $5.061 billion. A positive figure usually indicates a business that is selling off existing long- term assets and reducing its capacity for the future. So a negative number in this category is not a bad thing. The income statement shows a company's profit or a loss, while the balance sheet itemizes the value of its assets, liabilities, and owners' equity. Together, the two statements provide the means to answer two critical questions: (1) How much did the firm make or lose? and (2) How much is the firm presently worth based on historical values found on page 460 the balance sheet? Ratio analysis, calcula- tions that measure an organization's financial health, brings the complex information from the income statement and balance sheet into sharper focus so that managers, lenders, owners, and other interested parties can measure and compare the organization's LO 14-5 Analyze financial statements, using ratio analysis, to evaluate a company's performance. productivity, profitability, and financing mix with other similar entities. ratio analysis calculations that measure an organization's financial health. As you know, a ratio is simply one number divided by another, with the result showing the relationship between the two numbers. For example, we measure fuel efficiency with miles per gallon. This is how we know that 55 mpg in a Toyota Prius is much better than the average car. We use ratios in all sports, such as earned run and batting averages in baseball, field goal percentage in basketball, and percentage of passes completed in football. But, to make sense out of ratios, you have to know what you want to mea- sure. Financial ratios are used to weigh and evaluate a firm's performance. An absolute value such as earn- ings of $70,000 or accounts receivable of $200,000 almost never provides as much useful information as a well-constructed ratio. Whether those numbers are good or bad depends on their relation to other numbers. If a company earned $70,000 on $700,000 in sales (a 10 percent return), such an earnings level might be quite satisfactory. The president of a company earning this same $70,000 on sales of $7 million (a 1 percent return), however, should proba- bly start looking for another job! Ratios by themselves are not very useful. What matters is the relationship of the calculated ratios to the previous years performance, comparison to its competitors and the company's stated goals. Remember, while the profitability, asset utilization, liquidity, debt ratios, and per share data we'll look at here can be very useful, you will never see the forest by looking only at the trees. Profitability Ratios Profitability ratios measure how much operating income or net income an organization is able to gen- erate relative to its assets, owners' equity, and sales. The numerator (top number) used in these exam- ples is always the net income after taxes. Common profitability ratios include profit margin, return on assets, and return on equity. The following examples are based on the 2018 income statement and balance sheet for Microsoft, as shown in Tables 14.4 and 14.6. Except where specified, all data are expressed in millions of dollars. Microsoft's 2018 revenue grew $13.8 billion, driven by a $13 billion increase in service revenues that can mainly be attributed to Microsoft's success- ful commercial cloud storage business. Net income declined due to the $13.7 billion tax put in place by the Tax Cut and Jobs Act of 2017 mentioned previously The profit margin, computed by dividing net in- come by sales, shows the overall percentage of profits earned by the company. It is based solely upon data obtained from the income statement. The higher the profit margin, the better the cost controls within the company and the higher the return on every dollar of revenue. Microsoft's profit margin is calculated as follows: profitability ratios profit margin ratios that measure the amount of operating income or net income an organization is able to generate rel- ative to its assets, owners' equity, and sales. net income divided by sales. Net income Profit margin = Sales $16,571 $110,360 = 15.02% Net income Return on assets = Total assets $16,571 $258,848 = 6.40% page 461 Thus, for every $1 in sales, Microsoft generated profits after taxes of almost 15 cents. In the case of Microsoft, every $1 of assets gener- ated a return of 6.4 percent, or profits of 6.4 cents per dollar. Return on assets, net income divided by assets, shows how much income the firm produces for every dollar invested in assets. A company with a low return on assets is probably not using its assets very productivelya key managerial failing. For its com- putation, the return on assets calculation requires data from both the income statement and the bal- -a Stockholders are always concerned with how much money they will make on their investment, and they frequently use the return on equity ratio as one of their key performance yardsticks. Return on equity (also called return on investment (ROI)), calculated by dividing net income by owners' equity, shows how much income is generated by each $1 the owners have invested in the firm. Obviously, a low return on equity means low stockholder returns and may indicate a need for immediate managerial at- tention. Because some assets may have been financed ance sheet. return on assets net income divided by assets. with debt not contributed by the owners, the value of the owners' equity is usually considerably lower than the total value of the firm's assets. Microsoft's return on equity is calculated as follows: Asset Utilization Ratios return on equity net income divided by owners' equity; also called return on investment (ROI). Asset utilization ratios measure how well a firm uses its assets to generate each $1 of sales. Obviously, companies using their assets more productively will have higher returns on assets than their less efficient competitors. Similarly, managers can use asset uti- lization ratios to pinpoint areas of inefficiency in their operations. These ratios (receivables turnover, inventory turnover, and total asset turnover) relate balance sheet assets to sales, which are found on income statement. Net income Return on equity = Stockholders' equity $16,571 $82,718 = 20.03% For every dollar invested by Microsoft stockhold- ers, the company earned a 20.03 percent return, or 20.03 cents per dollar invested. asset utilization ratios ratios that measure how well a firm uses its assets to generate each $1 of sales. The receivables turnover, sales divided by accounts receivable, indicates how many times a firm collects its accounts receivable in one year. It also demon- strates how quickly a firm is able to collect payments on its credit sales. Obviously, no payments means no profits. Microsoft collected its receivables 4.17 times per year, which translates to about 86 days that receivables are outstanding. These ratios are based on a 360 day year. This is most likely due to the trade terms it gives its corporate cus- tomers. Inventory turnover, sales divided by total inven- tory, indicates how many times a firm sells and replaces its inventory over the course of a year. A high inventory turnover ratio may indicate great effi- ciency but may also suggest the possibility of lost sales due to insufficient stock levels. Microsoft's inventory turnover indicates that it replaced its inventory 41.46 times last year, or about every 8.7 days. This high inventory turnover is a reflection that Microsoft has very little physical inventory and instead downloads its Windows programs over the Internet. page 462 receivables turnover inventory turnover sales divided by accounts receivable. sales divided by total inventory. Sales Receivables turnover = Receivables $110,360 $26,481 = 4.17 times per year Sales Inventory turnover = Inventory $110,360 $2,662 = 41.46 times per year total asset turnover sales divided by total assets. Sales Total asset turnover Total assets $110,360 $258, 848 = 0.43 times per year = Liquidity Ratios Accountants often like to calculate inventory turnover using cost of goods sold in the numerator because inventory is carried on the books at cost and so is cost of goods sold. Financial analysts prefer sales in the numerator to measure the efficiency of inventory in producing revenues. Microsoft has very little physical inventory as opposed to an industrial company so using cost of goods sold would not pro- vide much meaningful information. Total asset turnover, sales divided by total assets, measures how well an organization uses all of its as- sets in creating sales. It indicates whether a company is using its assets productively. Microsoft generated $0.43 in sales for every $1 in total corporate assets. The cause of this low total asset turnover is the large cash balance that Microsoft has on its balance sheet. Cash does not produce sales dollars. At the end of 2018 more than 50 percent of its assets were held in cash or cash equivalents. Liquidity ratios compare current (short-term) assets to current liabilities to indicate the speed with which a company can turn its assets into cash to meet debts as they fall due. High liquidity ratios may satisfy a creditor's need for safety, but ratios that are too high may indicate that the organization is not using its current assets efficiently. Liquidity ratios are gener- ally best examined in conjunction with asset utilization ratios because high turnover ratios imply that cash is flowing through an organization very page 463 quicklya situation that dramatically reduces the need for the type of reserves measured by liquidity ratios. Current assets Current ratio = Current liabilities $169,662 $58,488 = 2.90 times liquidity ratios ratios that measure the speed with which a company can turn its assets into cash to meet short-term debt. The current ratio is calculated by dividing current assets by current liabilities. Microsoft's current ratio indicates that for every $1 of current liabilities, the firm had $2.90 of current assets on hand. The rela- tively high current ratio is also due to the $133,768 billion of cash, cash equivalents, and short-term in- vestments on hand, which is part of the current asset total. The quick ratio (also known as the acid test) is a far more stringent measure of liquidity because it eliminates inventory, the least liquid current asset. It measures how well an organization can meet its cur- rent obligations without resorting to the sale of its inventory. Because Microsoft has so little inventory, the quick ratio at 2.86 times is almost the same as the current ratio. quick ratio (acid test) a stringent measure of liquidity that eliminates inventory. current ratio current assets divided by current liabilities. Cash from financing activities is calcu- lated from changes in the long-term liability accounts and the contributed capital accounts in owners' equity. If this amount is negative, the com- pany is likely paying off long-term debt or returning contributed capital to investors. In the case of Micro- soft, it sold debt and repurchased $10.721 billion of its own stock and paid dividends of $12.699 billion, which resulted in a negative $33.590 billion cash flow from financing. Finally, cash from investing activities is calculated from changes in the long-term or fixed asset ac- Ratio Analysis: Analyzing Financial Statements counts. If this amount is negative, as is the case with Microsoft, we can see that the company bought $11.632 billion of property and equipment. It also purchased $137.380 billion of investments and sold $117.577 billion of investments and had $26.360 billion of investments mature for a total negative cash flow of $5.061 billion. A positive figure usually indicates a business that is selling off existing long- term assets and reducing its capacity for the future. So a negative number in this category is not a bad thing. The income statement shows a company's profit or a loss, while the balance sheet itemizes the value of its assets, liabilities, and owners' equity. Together, the two statements provide the means to answer two critical questions: (1) How much did the firm make or lose? and (2) How much is the firm presently worth based on historical values found on page 460 the balance sheet? Ratio analysis, calcula- tions that measure an organization's financial health, brings the complex information from the income statement and balance sheet into sharper focus so that managers, lenders, owners, and other interested parties can measure and compare the organization's LO 14-5 Analyze financial statements, using ratio analysis, to evaluate a company's performance. productivity, profitability, and financing mix with other similar entities. ratio analysis calculations that measure an organization's financial health. As you know, a ratio is simply one number divided by another, with the result showing the relationship between the two numbers. For example, we measure fuel efficiency with miles per gallon. This is how we know that 55 mpg in a Toyota Prius is much better than the average car. We use ratios in all sports, such as earned run and batting averages in baseball, field goal percentage in basketball, and percentage of passes completed in football. But, to make sense out of ratios, you have to know what you want to mea- sure. Financial ratios are used to weigh and evaluate a firm's performance. An absolute value such as earn- ings of $70,000 or accounts receivable of $200,000 almost never provides as much useful information as a well-constructed ratio. Whether those numbers are good or bad depends on their relation to other numbers. If a company earned $70,000 on $700,000 in sales (a 10 percent return), such an earnings level might be quite satisfactory. The president of a company earning this same $70,000 on sales of $7 million (a 1 percent return), however, should proba- bly start looking for another job! Ratios by themselves are not very useful. What matters is the relationship of the calculated ratios to the previous years performance, comparison to its competitors and the company's stated goals. Remember, while the profitability, asset utilization, liquidity, debt ratios, and per share data we'll look at here can be very useful, you will never see the forest by looking only at the trees. Profitability Ratios Profitability ratios measure how much operating income or net income an organization is able to gen- erate relative to its assets, owners' equity, and sales. The numerator (top number) used in these exam- ples is always the net income after taxes. Common profitability ratios include profit margin, return on assets, and return on equity. The following examples are based on the 2018 income statement and balance sheet for Microsoft, as shown in Tables 14.4 and 14.6. Except where specified, all data are expressed in millions of dollars. Microsoft's 2018 revenue grew $13.8 billion, driven by a $13 billion increase in service revenues that can mainly be attributed to Microsoft's success- ful commercial cloud storage business. Net income declined due to the $13.7 billion tax put in place by the Tax Cut and Jobs Act of 2017 mentioned previously The profit margin, computed by dividing net in- come by sales, shows the overall percentage of profits earned by the company. It is based solely upon data obtained from the income statement. The higher the profit margin, the better the cost controls within the company and the higher the return on every dollar of revenue. Microsoft's profit margin is calculated as follows: profitability ratios profit margin ratios that measure the amount of operating income or net income an organization is able to generate rel- ative to its assets, owners' equity, and sales. net income divided by sales. Net income Profit margin = Sales $16,571 $110,360 = 15.02% Net income Return on assets = Total assets $16,571 $258,848 = 6.40% page 461 Thus, for every $1 in sales, Microsoft generated profits after taxes of almost 15 cents. In the case of Microsoft, every $1 of assets gener- ated a return of 6.4 percent, or profits of 6.4 cents per dollar. Return on assets, net income divided by assets, shows how much income the firm produces for every dollar invested in assets. A company with a low return on assets is probably not using its assets very productivelya key managerial failing. For its com- putation, the return on assets calculation requires data from both the income statement and the bal- -a Stockholders are always concerned with how much money they will make on their investment, and they frequently use the return on equity ratio as one of their key performance yardsticks. Return on equity (also called return on investment (ROI)), calculated by dividing net income by owners' equity, shows how much income is generated by each $1 the owners have invested in the firm. Obviously, a low return on equity means low stockholder returns and may indicate a need for immediate managerial at- tention. Because some assets may have been financed ance sheet. return on assets net income divided by assets. with debt not contributed by the owners, the value of the owners' equity is usually considerably lower than the total value of the firm's assets. Microsoft's return on equity is calculated as follows: Asset Utilization Ratios return on equity net income divided by owners' equity; also called return on investment (ROI). Asset utilization ratios measure how well a firm uses its assets to generate each $1 of sales. Obviously, companies using their assets more productively will have higher returns on assets than their less efficient competitors. Similarly, managers can use asset uti- lization ratios to pinpoint areas of inefficiency in their operations. These ratios (receivables turnover, inventory turnover, and total asset turnover) relate balance sheet assets to sales, which are found on income statement. Net income Return on equity = Stockholders' equity $16,571 $82,718 = 20.03% For every dollar invested by Microsoft stockhold- ers, the company earned a 20.03 percent return, or 20.03 cents per dollar invested. asset utilization ratios ratios that measure how well a firm uses its assets to generate each $1 of sales. The receivables turnover, sales divided by accounts receivable, indicates how many times a firm collects its accounts receivable in one year. It also demon- strates how quickly a firm is able to collect payments on its credit sales. Obviously, no payments means no profits. Microsoft collected its receivables 4.17 times per year, which translates to about 86 days that receivables are outstanding. These ratios are based on a 360 day year. This is most likely due to the trade terms it gives its corporate cus- tomers. Inventory turnover, sales divided by total inven- tory, indicates how many times a firm sells and replaces its inventory over the course of a year. A high inventory turnover ratio may indicate great effi- ciency but may also suggest the possibility of lost sales due to insufficient stock levels. Microsoft's inventory turnover indicates that it replaced its inventory 41.46 times last year, or about every 8.7 days. This high inventory turnover is a reflection that Microsoft has very little physical inventory and instead downloads its Windows programs over the Internet. page 462 receivables turnover inventory turnover sales divided by accounts receivable. sales divided by total inventory. Sales Receivables turnover = Receivables $110,360 $26,481 = 4.17 times per year Sales Inventory turnover = Inventory $110,360 $2,662 = 41.46 times per year total asset turnover sales divided by total assets. Sales Total asset turnover Total assets $110,360 $258, 848 = 0.43 times per year = Liquidity Ratios Accountants often like to calculate inventory turnover using cost of goods sold in the numerator because inventory is carried on the books at cost and so is cost of goods sold. Financial analysts prefer sales in the numerator to measure the efficiency of inventory in producing revenues. Microsoft has very little physical inventory as opposed to an industrial company so using cost of goods sold would not pro- vide much meaningful information. Total asset turnover, sales divided by total assets, measures how well an organization uses all of its as- sets in creating sales. It indicates whether a company is using its assets productively. Microsoft generated $0.43 in sales for every $1 in total corporate assets. The cause of this low total asset turnover is the large cash balance that Microsoft has on its balance sheet. Cash does not produce sales dollars. At the end of 2018 more than 50 percent of its assets were held in cash or cash equivalents. Liquidity ratios compare current (short-term) assets to current liabilities to indicate the speed with which a company can turn its assets into cash to meet debts as they fall due. High liquidity ratios may satisfy a creditor's need for safety, but ratios that are too high may indicate that the organization is not using its current assets efficiently. Liquidity ratios are gener- ally best examined in conjunction with asset utilization ratios because high turnover ratios imply that cash is flowing through an organization very page 463 quicklya situation that dramatically reduces the need for the type of reserves measured by liquidity ratios. Current assets Current ratio = Current liabilities $169,662 $58,488 = 2.90 times liquidity ratios ratios that measure the speed with which a company can turn its assets into cash to meet short-term debt. The current ratio is calculated by dividing current assets by current liabilities. Microsoft's current ratio indicates that for every $1 of current liabilities, the firm had $2.90 of current assets on hand. The rela- tively high current ratio is also due to the $133,768 billion of cash, cash equivalents, and short-term in- vestments on hand, which is part of the current asset total. The quick ratio (also known as the acid test) is a far more stringent measure of liquidity because it eliminates inventory, the least liquid current asset. It measures how well an organization can meet its cur- rent obligations without resorting to the sale of its inventory. Because Microsoft has so little inventory, the quick ratio at 2.86 times is almost the same as the current ratio. quick ratio (acid test) a stringent measure of liquidity that eliminates inventory. current ratio current assets divided by current liabilities