Question
You are the assistant controller for Ball Jar Corp. You are tasked with analysis duties for the mass production department. Historically, the department has used
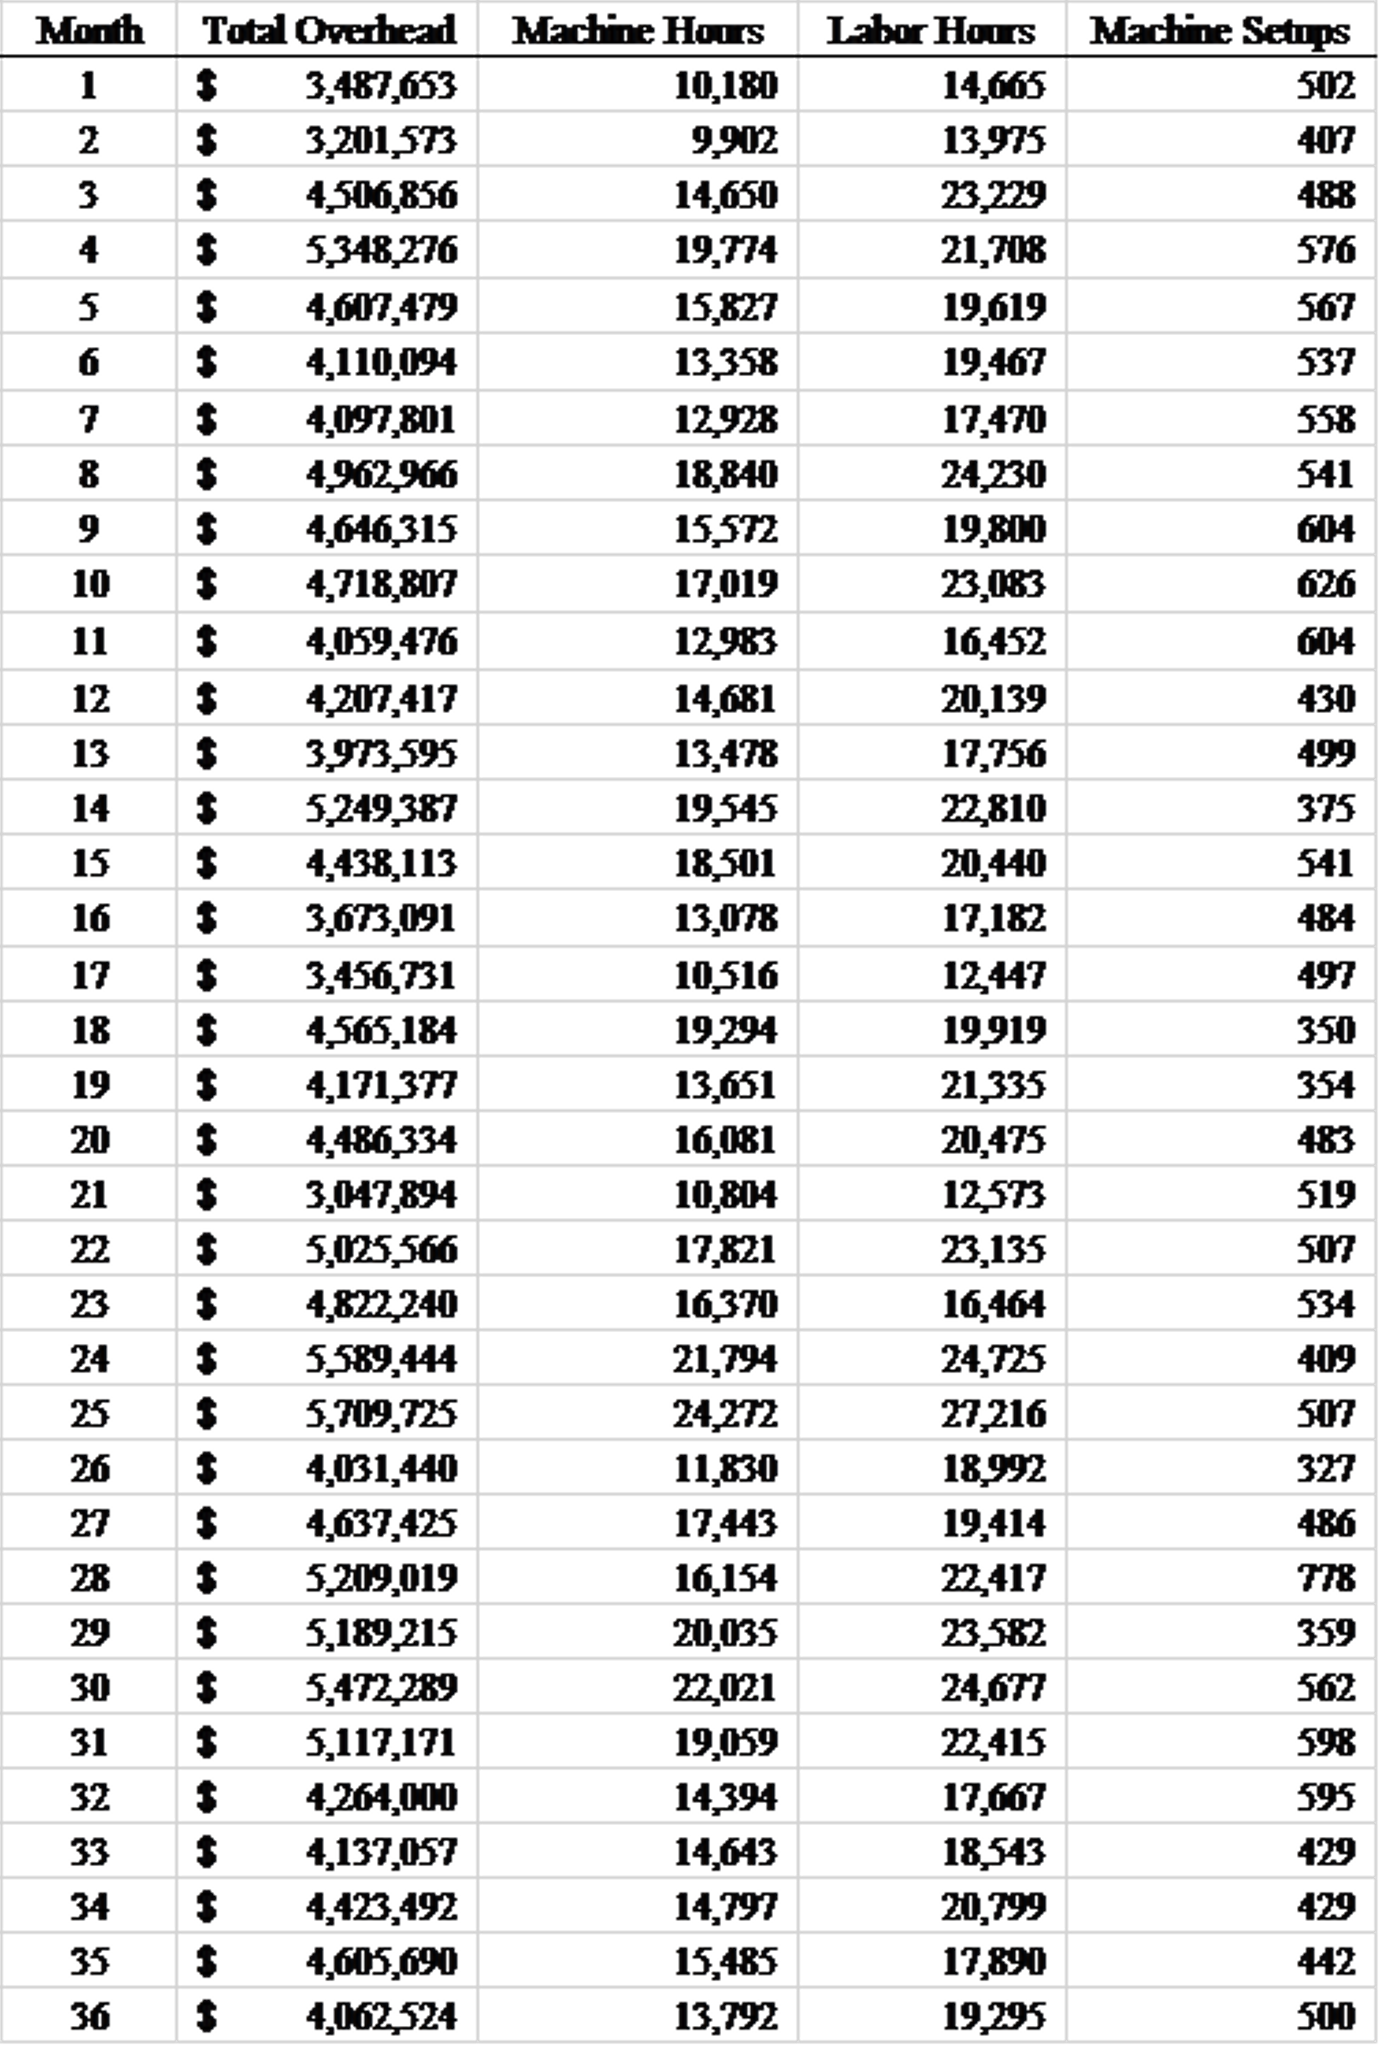
You are the assistant controller for Ball Jar Corp. You are tasked with analysis duties for the mass production department. Historically, the department has used machine hours to allocate overhead / indirect manufacturing costs. However, the CFO has asked you to look into determining if there are any other cost drivers the company should employ as the company looks to make the switch to activity based costing for overhead allocation. Given this assignment, you mine the companys information system to get some data on historical overhead costs and some cost drivers that you think are relevant. Below is this data.

A. You first want to establish if the chance of a relationship exists between each of these drivers individually and overhead costs. For each driver, sort the spreadsheet based upon the driver (be sure to sort the entire spreadsheet so rows stay together - you will have three separate sorts) and identify the 10th highest and tenth lowest observation for each.
1. Compute a high low equation (using the high low method) for each and then write out your high / low equation that you could use predict costs.
2. Did you get any unusual results? If so, why might that be the case?
3. Why might the results be so different between the three drivers?
4. Using each equation from #1, what are the predicted levels of overhead costs if machine hours = 20,000, labor hours = 15,000, or setups = 500 (you should have three separate calculations)?
B. After performing step A, you realize that we live in a multivariate world where lots of things simultaneously play a causal role in outcomes. You remember listening to Ole Doc Ayres lecture many years ago about the virtues of multivariate regression techniques and how they might help us in these situations. Run a multivariate regression to explain overhead costs using the three cost drivers as control variables and show the excel output for the regression.
1. For each variable, interpret the coefficient (i.e. what is it telling us?).
2. For each variable, what are the p-values telling us?
3. For the overall regression, what is the r-squared telling us?
4. What is the intercept emblematic of?
5. What would our predicted level of overhead costs be if machine hours = 20,000, labor hours = 15,000, and setups = 500?
6. Run the regression with only machine hours as a control variable and then run another one with both machine hours and labor hours as control variables. Do you see a trend in R-squared when we go from one control variable to two control variables to three control variables? Why might this be the case?
7. Based on this analysis, do you think activity based costing is a good idea for this company?
Month Total Overhea Machine Hors Labor Hors Marhine Setups $3.487,653 2$ 3,201573 35 4506,856 4$ 5,348276 5 $4,607,479 654,110,094 754,097801 10,180 14,665 2 14,650 19,774 15,827 3229 19,619 19467 17,470 18,840 9; 4,646315 10 54,718807 11$4,059476 12$4207417 13 $3.9T3595 14 55,249,387 15 $4438,113 16 $3,673,091 17 3,456,731 1854565,184 19 4,171,377 20;4,486,334 21$3,047,894 22$ 5,025566 2354,822 240 24 5,589,444 25$5,709.725 26$4,031,440 27$4,637,425 28;5209,019 29 5,189,215 3055472 289 3155.117171 32 54264,000 3354,137,057 3454,423,492 35 $4,605,690 36 54,062 524 17,019 3,083 16452 20,139 17,756 22,810 20440 17,182 12,447 14,681 13.478 13,078 13,651 16,081 10.84 17,821 21,335 20475 23,135 16,464 24,725 24272 11,830 17,443 16154 20,035 19414 22417 3,582 24,0T7 359 19.059 17,667 14,643 14,797 15,485 13,792 20.799 17,890Step by Step Solution
There are 3 Steps involved in it
Step: 1

Get Instant Access to Expert-Tailored Solutions
See step-by-step solutions with expert insights and AI powered tools for academic success
Step: 2

Step: 3

Ace Your Homework with AI
Get the answers you need in no time with our AI-driven, step-by-step assistance
Get Started


