Question
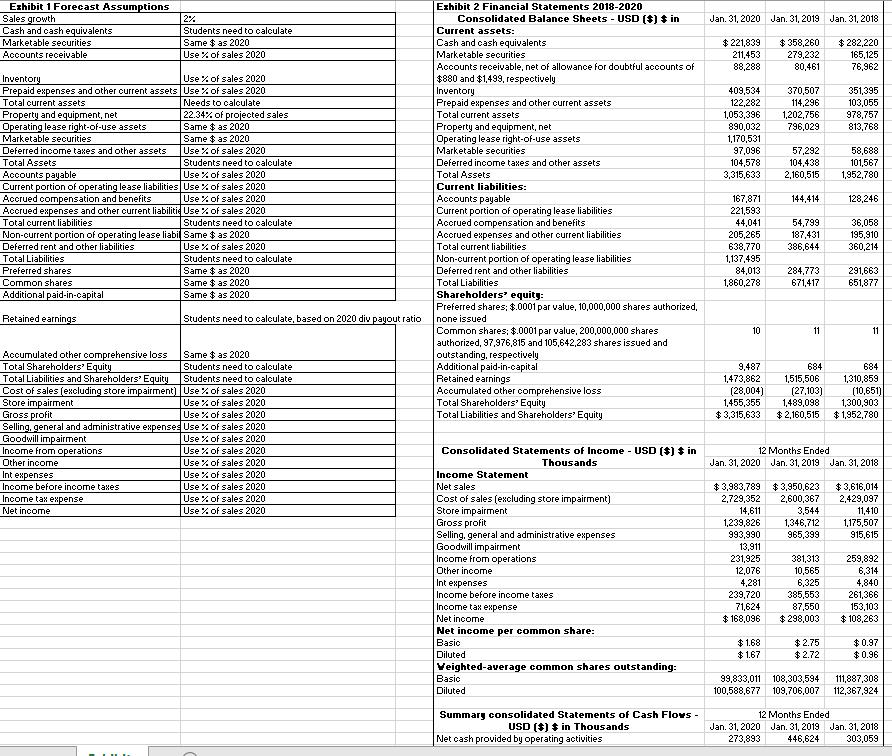
You are the CFO of a retail company, VL Inc. You just closed Fiscal Year 2020 and completed the balance sheets, income statements, and statement
You are the CFO of a retail company, VL Inc. You just closed Fiscal Year 2020 and completed the balance sheets, income statements, and statement of cashflows. Company CEO, Lee, is asking for a detail analysis of the company performance and projected information for 2021. During a recent senior manager meeting, Abbie, vice president of merchandising, expressed concern with one of the company's key suppliers, K Goods, Inc. This supplier is experiencing some financial difficulties due to the recent unexpected economical conditions. It is in need of external financing or it faces potential closure due to insolvency. Abbie suggests VL to invest into K Goods, since this will make strategic sense. She believes it is best to invest about 15% into K Goods' voting common stocks (Purchase cost of $10,500,000), but demand it makes her one of the directors of the board, so she can have influence into the company's future direction. Lee is leaning toward investing into K Goods in 2021 but has not made a final decision. Lee is waiting on your analysis of the current VL performance and the potential effects of investing into K Goods in 2021. All numbers and information provided are hypothetical.

Required Question:
1. Create forecasted Balance Sheet, Income Statement and Statement of Cashflows for 2021 without investing into K Goods. Use Exhibit 1 Forecast Assumptions and Exhibit 2 2018- 2020 Financial Statements to construct 2021 financial statements. Use the indirect method starting with projected net income to create the Statement of Cashflows.
a. Calculated total dividend payment in 2020 and 2021.
b. Calculated EPS for basic and diluted for 2021.
Exhibit 1 Forecast Assumptions Sales growth Cash and cash equivalents Marketable securities Accounts receivable Inventory Use % of sales 2020 Prepaid expenses and other current assets Use % of sales 2020 Total current assets Property and equipment, net Operating lease right-of-use assets Marketable securities Deferred income taxes and other assets Total Assets Accounts payable Current portion of operating lease liabilities Accrued compensation and benefits Accrued expenses and other current liabilitie Total current liabilities Non-current portion of operating lease liabil Deferred rent and other liabilities Total Liabilities 2% Students need to calculate Same $ as 2020 Use % of sales 2020 Preferred shares Common shares Additional paid-in-capital Retained earnings Needs to calculate 22.34% of projected sales Same $ as 2020 Same $ as 2020 Use % of sales 2020 Students need to calculate Use % of sales 2020 Use % of sales 2020 Use % of sales 2020 Use % of sales 2020 Students need to calculate Same $ as 2020 Use % of sales 2020 Students need to calculate Same $ as 2020 Same $ as 2020 Same $ as 2020 Students need to calculate, based on 2020 div payout ratio Accumulated other comprehensive loss Total Shareholders' Equity Total Liabilities and Shareholders' Equity Cost of sales (excluding store impairment) Store impairment Gross profit Use % of sales 2020 Selling, general and administrative expenses Use % of sales 2020 Goodwill impairment Income from operations Other income Use % of sales 2020 Use % of sales 2020 Use % of sales 2020 Use % of sales 2020 Use % of sales 2020 Use % of sales 2020 Int expenses Income before income taxes Income tax expense Net income Use % of sales 2020 Same $ as 2020 Students need to calculate Students need to calculate Use % of sales 2020 Use % of sales 2020 Exhibit 2 Financial Statements 2018-2020 Consolidated Balance Sheets - USD ($) $ in Current assets: Cash and cash equivalents Marketable securities Accounts receivable, net of allowance for doubtful accounts of $880 and $1,499, respectively Inventory Prepaid expenses and other current assets Total current assets Property and equipment, net Operating lease right-of-use assets Marketable securities Deferred income taxes and other assets Total Assets Current liabilities: Accounts payable Current portion of operating lease liabilities Accrued compensation and benefits Accrued expenses and other current liabilities Total current liabilities Non-current portion of operating lease liabilities Deferred rent and other liabilities Total Liabilities Shareholders' equity: Preferred shares; $.0001 par value, 10,000,000 shares authorized, none issued Common shares; $.0001 par value, 200,000,000 shares authorized, 97,976,815 and 105,642,283 shares issued and outstanding, respectively Additional paid-in-capital Retained earnings Accumulated other comprehensive loss Total Shareholders' Equity Total Liabilities and Shareholders' Equity Consolidated Statements of Income - USD ($) $ in Thousands Income Statement Net sales Cost of sales (excluding store impairment) Store impairment Gross profit Selling, general and administrative expenses Goodwill impairment Income from operations Other income Int expenses Income before income taxes Income tax expense Net income Net income per common share: Basic Diluted Veighted-average common shares outstanding: Basic Diluted Summary consolidated Statements of Cash Flows - USD ($) * in Thousands Net cash provided by operating activities Jan. 31, 2020 Jan. 31, 2019 Jan. 31, 2018 $ 221,839 211,453 88,288 409,534 122,282 1,053,396 890,032 1,170,531 97,096 104,578 3,315,633 167,871 221,593 44,041 205,265 638,770 1,137,495 84,013 1,860,278 10 9,487 1,473,862 (28,004) 1,455,355 $3,315,633 Jan. 31, 2020 $ 3,983,789 2,729,352 14,611 1,239,826 993,990 13,911 231,925 12,076 4,281 239,720 71,624 $ 168,096 $ 358,260 279,232 80,461 $1.68 $1.67 370,507 114,296 1,202,756 796,029 57,292 104,438 2,160,515 144,414 54,799 187,431 386,644 284,773 671,417 11 12 Months Ended 684 1,515,506 (27,103) $ 3,950,623 2,600,367 3,544 1,346,712 965,399 381,313 10,565 6,325 385,553 87,550 $ 298,003 $282,220 165,125 76,962 $2.75 $2.72 351,395 103,055 978,757 813,768 58,688 101,567 1,952,780 99,833,011 108,303,594 100,588,677 128,246 1,489,098 1,300,903 $2,160,515 $1,952,780 36,058 195,910 360,214 291,663 651,877 Jan. 31, 2019 Jan. 31, 2018 11 684 1,310,859 (10,651) $3,616,014 2,429,097 11,410 1,175,507 915,615 259,892 6,314 4,840 261,366 153,103 $ 108,263 $0.97 $0.96 111,887,308 109,706,007 112,367,924 12 Months Ended Jan. 31, 2020 Jan. 31, 2019 Jan. 31, 2018 273,893 446,624 303,059
Step by Step Solution
3.52 Rating (145 Votes )
There are 3 Steps involved in it
Step: 1
Given the data provided in Exhibit 1 and Exhibit 2 I will calculate the total dividend payment for the years 2020 and 2021 and the basic and diluted EPS for 2021 Please note that all calculations are ...
Get Instant Access to Expert-Tailored Solutions
See step-by-step solutions with expert insights and AI powered tools for academic success
Step: 2

Step: 3

Ace Your Homework with AI
Get the answers you need in no time with our AI-driven, step-by-step assistance
Get Started


