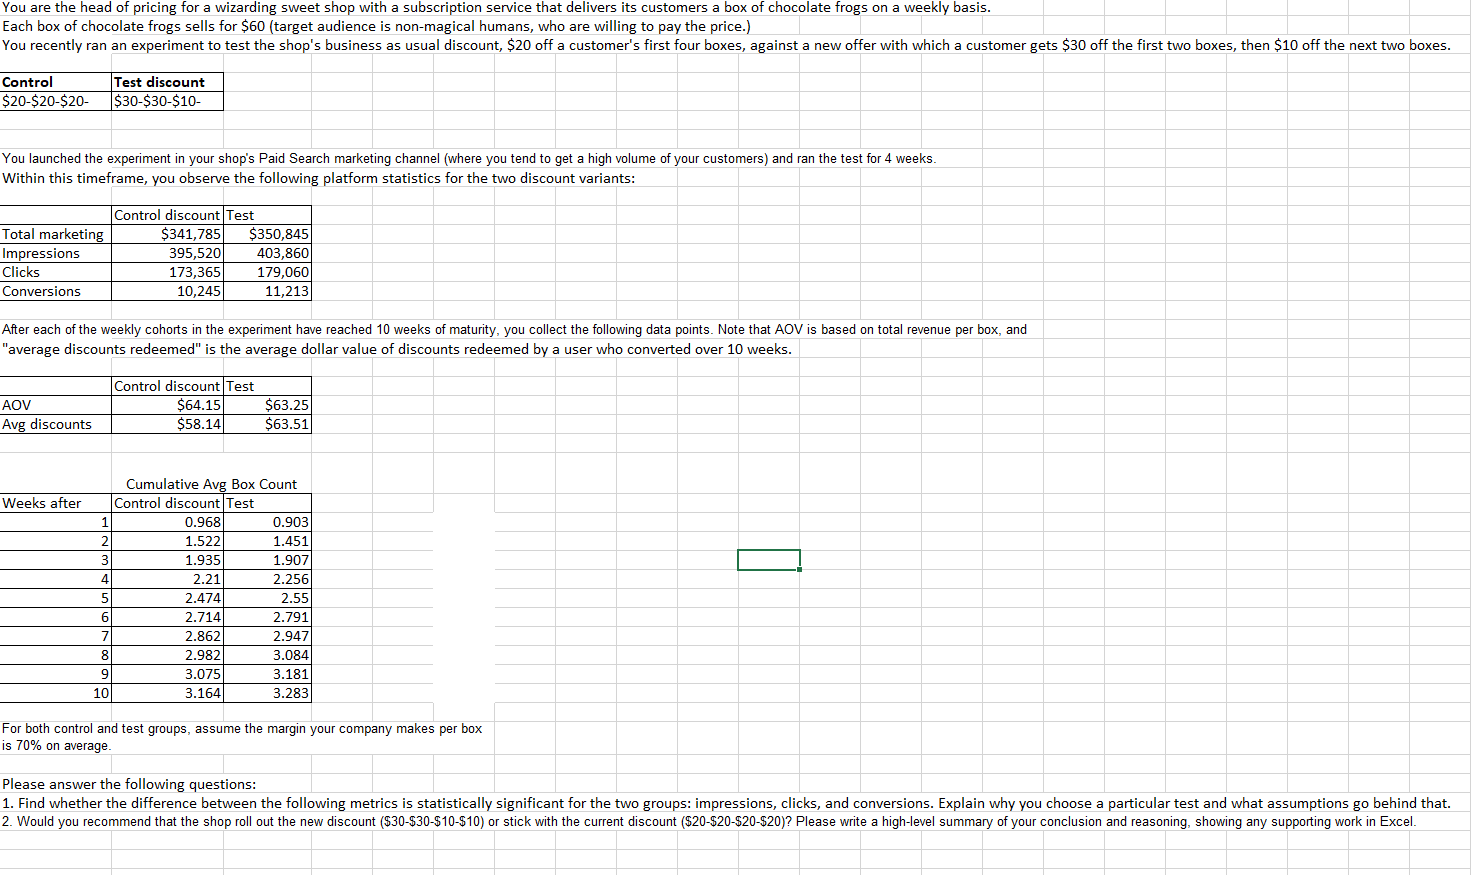


You are the head of pricing for a wizarding sweet shop with a subscription service that delivers its customers a box of chocolate frogs on a weekly basis. Each box of chocolate frogs sells for $60 (target audience is non-magical humans, who are willing to pay the price.) You recently ran an experiment to test the shop's business as usual discount, $20 off a customer's first four boxes, against a new offer with which a customer gets $30 off the first two boxes, then $10 off the next two boxes. Control $20-$20-$20- Test discount $30-$30-$10- You launched the experiment in your shop's Paid Search marketing channel (where you tend to get a high volume of your customers) and ran the test for 4 weeks. Within this timeframe, you observe the following platform statistics for the two discount variants: Total marketing Impressions Clicks Conversions Control Test $341,785 $350,845 395,520 403,860 173,365 179,060 10,245 11,213 After each of the weekly cohorts in the experiment have reached 10 weeks of maturity, you collect the following data points. Note that AOV is based on total revenue per box, and "average discounts redeemed" is the average dollar value of discounts redeemed by a user who converted over 10 weeks. Control Test AOV Avg discounts $64.15 $58.14 $63.25 $63.51 Weeks after 1 2 3 4 Cumulative Avg Box Count Control Test 0.968 0.903 1.522 1.451 1.935 1.907 2.21 2.256 2.474 2.55 2.714 2.791 2.862 2.947 2.982 3.084 3.075 3.181 3.164 3.283 5 6 7 8 9 10 For both control and test groups, assume the margin your company makes per box is 70% on average. Please answer the following questions: 1. Find whether the difference between the following metrics is statistically significant for the two groups: impressions, clicks, and conversions. Explain why you choose a particular test and what assumptions go behind that. 2. Would you recommend that the shop roll out the new discount ($30-$30-$10-$10) or stick with the current discount ($20-$20-$20-$20)? Please write a high-level summary of your conclusion and reasoning, showing any supporting work in Excel. You are the head of pricing for a wizarding sweet shop with a subscription service that delivers its customers a box of chocolate frogs on a weekly basis. Each box of chocolate frogs sells for $60 (target audience is non-magical humans, who are willing to pay the price.) You recently ran an experiment to test the shop's business as usual discount, $20 off a customer's first four boxes, against a new offer with which a customer gets $30 off the first two boxes, then $10 off the next two boxes. Control $20-$20-$20- Test discount $30-$30-$10- 4 weeks You launched the experiment in your shop's Paid Search marketing channel (where you tend to get a high volume of your customers) and ran the test Within this timeframe, you observe the following platform statistics for the two discount variants: Total marketing Impressions Clicks Conversions Control discount Test $341,785 $350,845 395,520 403,860 173,365 179,060 10,245 11,213 After each of the weekly cohorts in the experiment have reached 10 weeks of maturity, you collect the following data points. Note that AOV is based on total revenue per box, and "average discounts redeemed" is the average dollar value of discounts redeemed by a user who converted over 10 weeks. AOV Avg discounts Control discount Test $64.15 $58.14 $63.25 $63.51 Weeks after Cumulative Avg Box Count Control discount Test 0.968 0.903 2 1.522 1.451 3 1.935 1.907 4 2.21 2.256 5 2.474 2.55 6 2.714 2.791 7 2.862 2.947 8 2.982 3.084 9 3.075 3.181 10 3.164 3.283 For both control and test groups, assume the margin your company makes per box is 70% on average. Please answer the following questions: 1. Find whether the difference between the following metrics is statistically significant for the two groups: impressions, clicks, and conversions. Explain why you choose a particular test and what assumptions go behind that. 2. Would you recommend that the shop roll out the new discount ($30-$30-$10-$10) or stick with the current discount ($20-$20-$20-$20)? Please write a high-level summary of your conclusion and reasoning, showing any supporting work in Excel. You are the head of pricing for a wizarding sweet shop with a subscription service that delivers its customers a box of chocolate frogs on a weekly basis. Each box of chocolate frogs sells for $60 (target audience is non-magical humans, who are willing to pay the price.) You recently ran an experiment to test the shop's business as usual discount, $20 off a customer's first four boxes, against a new offer with which a customer gets $30 off the first two boxes, then $10 off the next two boxes. Control $20-$20-$20- Test discount $30-$30-$10- You launched the experiment in your shop's Paid Search marketing channel (where you tend to get a high volume of your customers) and ran the test for 4 weeks. Within this timeframe, you observe the following platform statistics for the two discount variants: Total marketing Impressions Clicks Conversions Control Test $341,785 $350,845 395,520 403,860 173,365 179,060 10,245 11,213 After each of the weekly cohorts in the experiment have reached 10 weeks of maturity, you collect the following data points. Note that AOV is based on total revenue per box, and "average discounts redeemed" is the average dollar value of discounts redeemed by a user who converted over 10 weeks. Control Test AOV Avg discounts $64.15 $58.14 $63.25 $63.51 Weeks after 1 2 3 4 Cumulative Avg Box Count Control Test 0.968 0.903 1.522 1.451 1.935 1.907 2.21 2.256 2.474 2.55 2.714 2.791 2.862 2.947 2.982 3.084 3.075 3.181 3.164 3.283 5 6 7 8 9 10 For both control and test groups, assume the margin your company makes per box is 70% on average. Please answer the following questions: 1. Find whether the difference between the following metrics is statistically significant for the two groups: impressions, clicks, and conversions. Explain why you choose a particular test and what assumptions go behind that. 2. Would you recommend that the shop roll out the new discount ($30-$30-$10-$10) or stick with the current discount ($20-$20-$20-$20)? Please write a high-level summary of your conclusion and reasoning, showing any supporting work in Excel. You are the head of pricing for a wizarding sweet shop with a subscription service that delivers its customers a box of chocolate frogs on a weekly basis. Each box of chocolate frogs sells for $60 (target audience is non-magical humans, who are willing to pay the price.) You recently ran an experiment to test the shop's business as usual discount, $20 off a customer's first four boxes, against a new offer with which a customer gets $30 off the first two boxes, then $10 off the next two boxes. Control $20-$20-$20- Test discount $30-$30-$10- 4 weeks You launched the experiment in your shop's Paid Search marketing channel (where you tend to get a high volume of your customers) and ran the test Within this timeframe, you observe the following platform statistics for the two discount variants: Total marketing Impressions Clicks Conversions Control discount Test $341,785 $350,845 395,520 403,860 173,365 179,060 10,245 11,213 After each of the weekly cohorts in the experiment have reached 10 weeks of maturity, you collect the following data points. Note that AOV is based on total revenue per box, and "average discounts redeemed" is the average dollar value of discounts redeemed by a user who converted over 10 weeks. AOV Avg discounts Control discount Test $64.15 $58.14 $63.25 $63.51 Weeks after Cumulative Avg Box Count Control discount Test 0.968 0.903 2 1.522 1.451 3 1.935 1.907 4 2.21 2.256 5 2.474 2.55 6 2.714 2.791 7 2.862 2.947 8 2.982 3.084 9 3.075 3.181 10 3.164 3.283 For both control and test groups, assume the margin your company makes per box is 70% on average. Please answer the following questions: 1. Find whether the difference between the following metrics is statistically significant for the two groups: impressions, clicks, and conversions. Explain why you choose a particular test and what assumptions go behind that. 2. Would you recommend that the shop roll out the new discount ($30-$30-$10-$10) or stick with the current discount ($20-$20-$20-$20)? Please write a high-level summary of your conclusion and reasoning, showing any supporting work in Excel


