Question
You are the manager and have to make the production decisions for the next six months. You do this by entering values into the blue-shaded
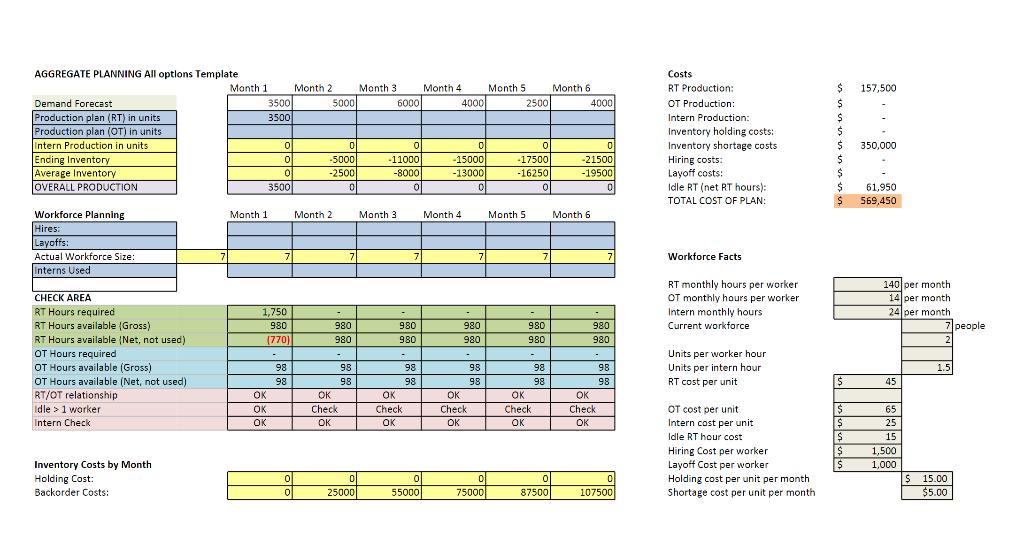
You are the manager and have to make the production decisions for the next six months. You do this by entering values into the blue-shaded cells. In rows 5 through 6 you indicate how many units need to be produced. In rows 13 and 14 you enter the number of workers that you hire or lay off. Hiring and firing happens at the beginning of each month. Row 16 is the number of interns that are used. The interns are hired on a month-by-month basis. If you want two in both months 1 and 2, you have to enter "2" C16 and D16.
Think of this as a game or big puzzle. There are some rules:
Inventory: You have unlimited storage space. Each unit stored incurs an inventory holding cost (Cell K6). You can have backorders, which would be a negative inventory. However, backorders incur a per-unit cost (Cell K7).
Interns: You can use interns. You make that decision on a month-by-month basis and there is no hiring or firing cost. You must have at least 2 workers for every intern; if you wanted to use 5 interns you have to have at least 10 regular workers.
Overtime: Each worker can only work 14 hours of OT per month.
Begin by just playing around. You might think "I have demand for 3500 in Month 1, I'll put 3500 in C5." Try this. Now go down to the area labeled "CHECK AREA" starting in row 18. You will see that with the starting workforce of 7 workers, you had 980 hours available and C21 has a big red negative 770 hours. You don't have enough labor to produce 3500. Even if you used all of the OT available (the 98 in cell C23) you wouldn't have enough. Even with maximum interns, you won't have enough. You need to hire. Each worker can give you 280 units (140 hours times 2 items per hour.) Hire some workers (in cell C13) then increase production in cell C5 Then double-check to be sure you haven't broken a rule. Experiment with different options. And study the graphs below each plan to see if they look like level, chase, or something else as you make decisions.
Now
You need to create three plans:
A “pure” level plan. With a level plan you make exactly the same number of items each month. RT, OT, and Interns will all have the same values each month. You can make hiring/layoff decisions only in month one.
A “pure” chase plan. This is a little less restrictive. Here overall production and demand have to be equal, or as near equal as possible. (You can’t use a fractional worker or fractional part of an hour to get an exact match.)
A plan you devise yourself. You must identify your goal with this plan. Do that in cell D3 in the Comparison Table worksheet. Example: To maximize held inventory.
What to turn in:
Your completed spreadsheet.
pros and cons for each plan and a recommendation or conclusion.

AGGREGATE PLANNING All options Template Demand Forecast Production plan (RT) in units Production plan (OT) in units Intern Production in units. Ending Inventory Average Inventory OVERALL PRODUCTION Workforce Planning Hires: Layoffs: Actual Workforce Size: Interns Used CHECK AREA RT Hours required RT Hours available (Gross) RT Hours available (Net, not used) OT Hours required OT Hours available (Gross) OT Hours available (Net, not used) RT/OT relationship Idle > 1 worker Intern Check Inventory Costs by Month Holding Cost: Backorder Costs: 7 Month 1 Month 1 3500 3500 OK OK OK 0 0 0 3500 1,750 980 (770) 7 - 98 98 0 0 Month 2 5000 0 -5000 -2500 0 Month 2 980 980 - 7 OK Check OK 98 98 0 25000 Month 3 6000 0 -11000 -8000 0 Month 3 980 980 - 7 OK Check OK 98 98 0 55000 Month 4. 4000 0 -15000 -13000 0 Month 4 7 980 980 OK Check OK 98 98 0 75000 Month 5 2500 0 -17500 -16250 0 Month 5 7 980 980 OK Check OK 98 98 0 87500 Month 6 4000 01 -21500 -19500 0 Month 6 7 980 980 OK Check OK 98 98 0 107500 Costs RT Production: OT Production: Intern Production: Inventory holding costs: Inventory shortage costs Hiring costs: Layoff costs: Idle RT (net RT hours): TOTAL COST OF PLAN: Workforce Facts RT monthly hours per worker OT monthly hours per worker Intern monthly hours Current workforce Units per worker hour. Units per intern hour RT cost per unit OT cost per unit Intern cost per unit Idle RT hour cost Hiring Cost per worker Layoff Cost per worker Holding cost per unit per month Shortage cost per unit per month $ $ $ $ $ 350,000 $ $ $ $ S $ $ $ $ 157,500 61,950 569,450 140 per month 14 per month 24 per month 45 65 25 15 1,500 1,000 7 people 2 1.5 $ 15.00 $5.00
Step by Step Solution
There are 3 Steps involved in it
Step: 1
Production Planning Puzzle Taking the Helm Im excited to tackle this production planning puzzle with youIt sounds like a fascinating challengebalancin...
Get Instant Access to Expert-Tailored Solutions
See step-by-step solutions with expert insights and AI powered tools for academic success
Step: 2

Step: 3

Ace Your Homework with AI
Get the answers you need in no time with our AI-driven, step-by-step assistance
Get Started


