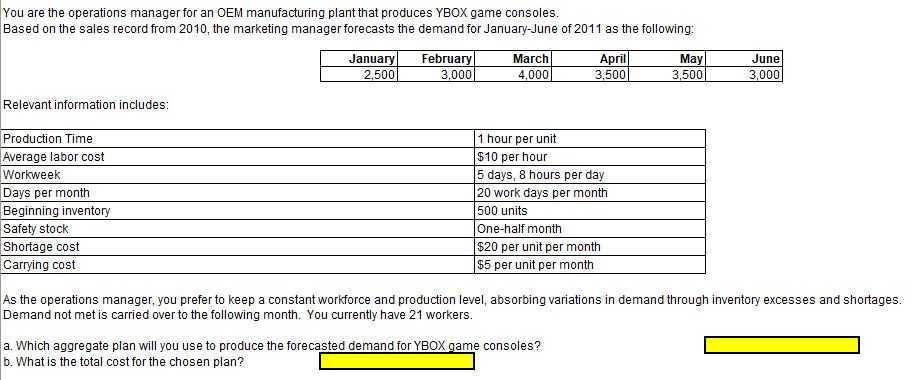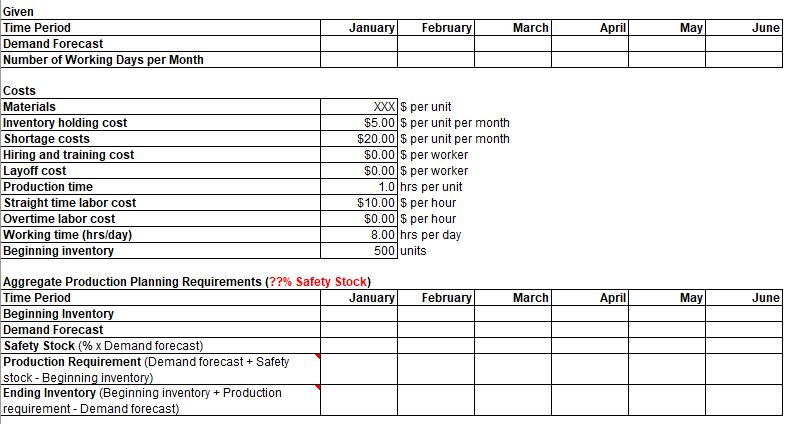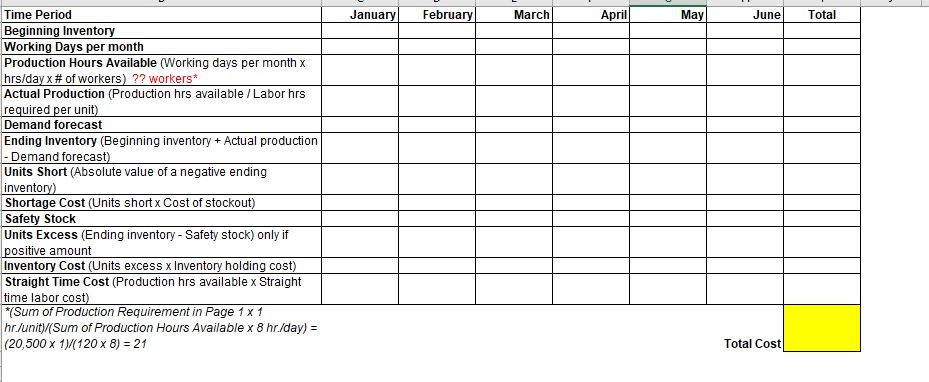


You are the operations manager for an OEM manufacturing plant that produces YBOX game consoles Based on the sales record from 2010, the marketing manager forecasts the demand for January-June of 2011 as the following: April 3,500 January 2,500 February March May June 3,000 3,000 4,000 3,500 Relevant information includes: 1 hour per unit Production Time Average labor cost $10 per hour Workweek 5 days, 8 hours per day 20 work days per month Days per month Beginning inventory Safety stock Shortage cost Carrying cost 500 units One-half month $20 per unit per month $5 per unit per month As the operations manager, you prefer to keep a constant workforce and production level, absorbing variations in demand through inventory excesses and shortages Demand not met is carried over to the following month. You currently have 21 workers. a. Which aggregate plan will you use to produce the forecasted demand for YBOX game consoles? b. What is the total cost for the chosen plan? Given Time Period January February March April May June Demand Forecast Number of Working Days per Month Costs Materials XXXI$ per unit Inventory holding cost Shortage costs Hiring and training cost Layoff cost Production time Straight time labor cost Overtime labor cost $5.00 S per unit per month $20.00 S per unit per month $0.00 $ per worker $0.00 $ per worker 1.0 hrs per unit $10.00 $ per hour $0.00 $ per hour 8.00 hrs per day 500 units Working time (hrs/day) Beginning inventory Aggregate Production Planning Requirements (??% Safety Stock) January Time Period February March April May June Beginning Inventory Demand Forecast Safety Stock (% x Demand forecast) Production Requirement (Demand forecast+ Safety stock-Beginning inventory) Ending Inventory (Beginning inventory Production requirement - Demand forecast) Time Period February January March April May June Total Beginning Inventory Working Days per month Production Hours Available (Working days per monthx hrs/day x # of workers) ?? workers* Actual Production (Production hrs available / Labor hrs required per unit) Demand forecast Ending Inventory (Beginning inventory Actual production - Demand forecast) Units Short (Absolute value of a negative ending inventory) Shortage Cost (Units short x Cost of stockout) Safety Stock Units Excess (Ending inventory Safety stock) only if positive amount Inventory Cost (Units excess x Inventory holding cost) Straight Time Cost (Production hrs available x Straight time labor cost) *(Sum of Production Requirement in Page 1 x 1 hr/unit)/(Sum of Production Hours Available x 8 hr/day) (20,500 x 1)/(120 x 8) 21 Total Cost


