Answered step by step
Verified Expert Solution
Question
1 Approved Answer
, you are to examine the 2019 financial statements of Sprouts Farmers Market, Inc., and use that report to answer the questions that follow. For
, you are to examine the 2019 financial statements of Sprouts Farmers Market, Inc., and use that report to answer the questions that follow. For full credit, show all calculations
2. What is the par value of the common stock?
a. Did the company pay a cash dividend in the most recent year? If so, how much?
b. If a company does not pay dividends, what might the reason be?
c. Why would people invest in a company that did not pay dividends?
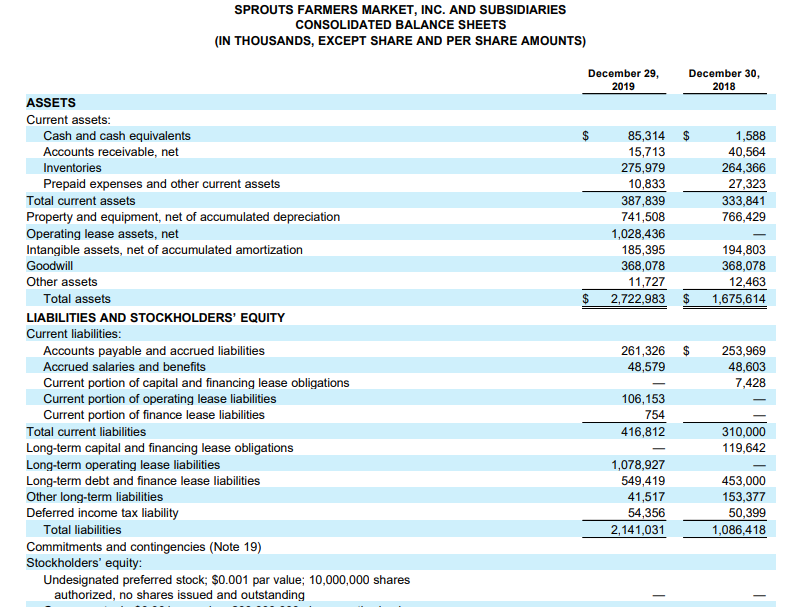
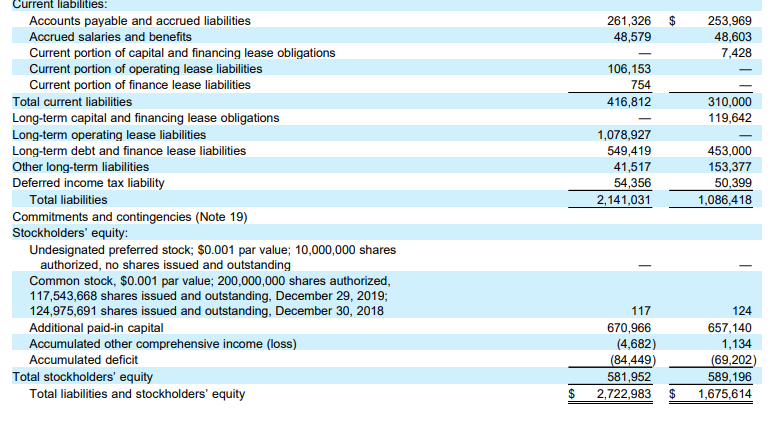
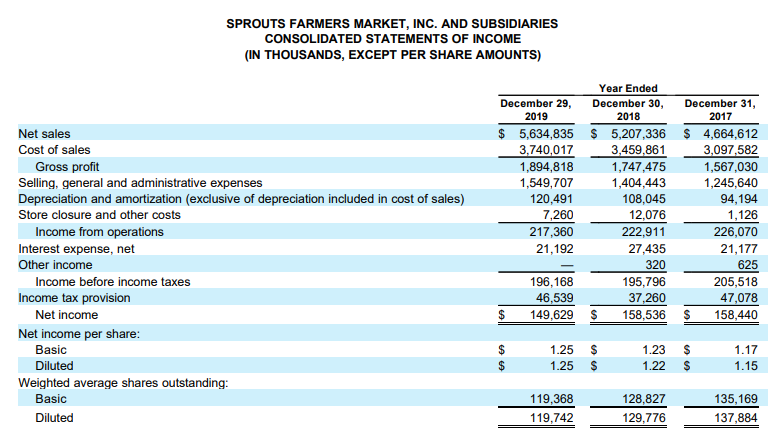
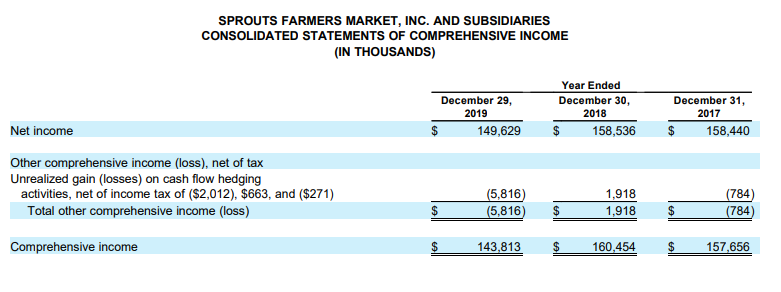
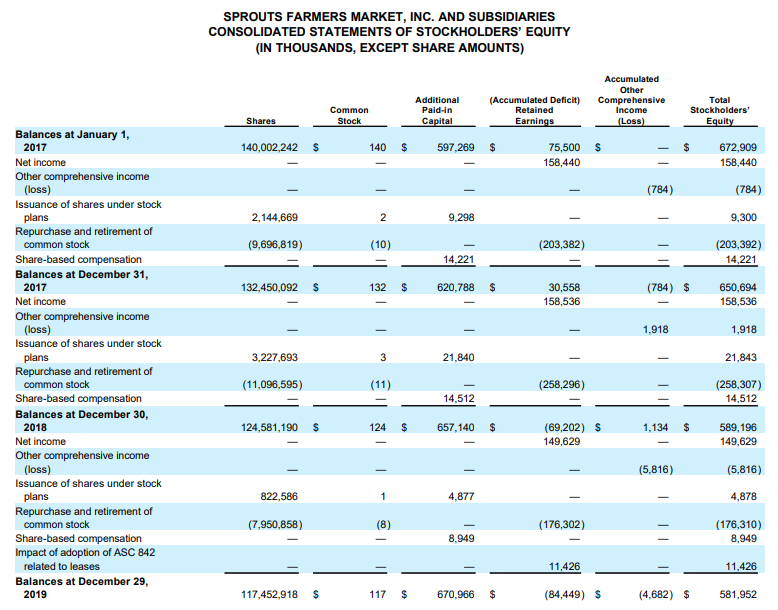
SPROUTS FARMERS MARKET, INC. AND SUBSIDIARIES CONSOLIDATED BALANCE SHEETS (IN THOUSANDS, EXCEPT SHARE AND PER SHARE AMOUNTS) December 29, 2019 December 30, 2018 85,314 $ 15,713 275,979 10,833 387,839 741,508 1,028,436 185,395 368,078 11,727 2,722,983 $ 1,588 40,564 264,366 27,323 333,841 766,429 194,803 368,078 12,463 1,675,614 $ ASSETS Current assets: Cash and cash equivalents Accounts receivable, net Inventories Prepaid expenses and other current assets Total current assets Property and equipment, net of accumulated depreciation Operating lease assets, net Intangible assets, net of accumulated amortization Goodwill Other assets Total assets LIABILITIES AND STOCKHOLDERS' EQUITY Current liabilities: Accounts payable and accrued liabilities Accrued salaries and benefits Current portion of capital and financing lease obligations Current portion of operating lease liabilities Current portion of finance lease liabilities Total current liabilities Long-term capital and financing lease obligations Long-term operating lease liabilities Long-term debt and finance lease liabilities Other long-term liabilities Deferred income tax liability Total liabilities Commitments and contingencies (Note 19) Stockholders' equity: Undesignated preferred stock; $0.001 par value; 10,000,000 shares authorized, no shares issued and outstanding $ 261,326 48,579 253,969 48,603 7,428 106,153 754 416,812 310,000 119,642 1,078,927 549,419 41,517 54,356 2,141,031 453,000 153,377 50,399 1,086,418 261,326 48,579 253,969 48,603 7,428 106,153 754 416,812 310,000 119,642 Current liabilities: Accounts payable and accrued liabilities Accrued salaries and benefits Current portion of capital and financing lease obligations Current portion of operating lease liabilities Current portion of finance lease liabilities Total current liabilities Long-term capital and financing lease obligations Long-term operating lease liabilities Long-term debt and finance lease liabilities Other long-term liabilities Deferred income tax liability Total liabilities Commitments and contingencies (Note 19) Stockholders' equity: Undesignated preferred stock; $0.001 par value; 10,000,000 shares authorized, no shares issued and outstanding Common stock, $0.001 par value; 200,000,000 shares authorized, 117,543,668 shares issued and outstanding, December 29, 2019 124,975,691 shares issued and outstanding, December 30, 2018 Additional paid-in capital Accumulated other comprehensive income (loss) Accumulated deficit Total stockholders' equity Total liabilities and stockholders' equity 1,078,927 549,419 41,517 54,356 2,141,031 453,000 153,377 50,399 1,086,418 117 670,966 (4,682) (84,449) 581,952 2,722,983 124 657,140 1,134 (69,202) 589,196 1,675,614 $ $ SPROUTS FARMERS MARKET, INC. AND SUBSIDIARIES CONSOLIDATED STATEMENTS OF INCOME (IN THOUSANDS, EXCEPT PER SHARE AMOUNTS) Net sales Cost of sales Gross profit Selling, general and administrative expenses Depreciation and amortization (exclusive of depreciation included in cost of sales) Store closure and other costs Income from operations Interest expense, net Other income Income before income taxes Income tax provision Net income Net income per share: Basic Diluted Weighted average shares outstanding: Basic Diluted Year Ended December 29, December 30, December 31, 2019 2018 2017 $ 5,634,835 $ 5,207,336 $ 4,664,612 3,740,017 3,459,861 3,097,582 1,894,818 1,747,475 1,567,030 1,549,707 1,404,443 1,245,640 120,491 108,045 94,194 7,260 12,076 1,126 217,360 222,911 226,070 21,192 27,435 21,177 320 625 196,168 195,796 205,518 46.539 37.260 47,078 $ 149,629 $ 158,536 $ 158,440 1.25 1.25 $ $ 1.23 $ 1.22 $ 1.17 1.15 $ 119,368 119,742 128.827 129,776 135,169 137,884 SPROUTS FARMERS MARKET, INC. AND SUBSIDIARIES CONSOLIDATED STATEMENTS OF COMPREHENSIVE INCOME (IN THOUSANDS) December 29, 2019 149,629 Year Ended December 30, 2018 $ 158,536 December 31, 2017 $ 158,440 Net income Other comprehensive income (loss), net of tax Unrealized gain (losses) on cash flow hedging activities, net of income tax of ($2,012), $663, and ($271) Total other comprehensive income (loss) (5,816) (5,816) 1,918 1,918 (784) (784) $ $ $ Comprehensive income all 143,813 160.454 $ 157,656 SPROUTS FARMERS MARKET, INC. AND SUBSIDIARIES CONSOLIDATED STATEMENTS OF STOCKHOLDERS' EQUITY (IN THOUSANDS, EXCEPT SHARE AMOUNTS) Additional Paid-in Capital Common Stock Accumulated Other Comprehensive Income (Loss) (Accumulated Deficit) Retained Earnings Total Stockholders' Equity Shares 140,002,242 $ 140 $ 597,269 75,500 $ 158,440 672.909 158,440 - (784) (784) 2, 144,669 2 9,298 9,300 (9,696,819) (10) (203,382) (203,392) 14,221 14.221 132,450,092 $ 132 $ 620.788 30,558 158,536 (784) $ 650,694 158,536 1,918 1,918 3,227,693 3 Balances at January 1, 2017 Net income Other comprehensive income (loss) Issuance of shares under stock plans Repurchase and retirement of common stock Share-based compensation Balances at December 31, 2017 Net income Other comprehensive income (loss) Issuance of shares under stock plans Repurchase and retirement of common stock Share-based compensation Balances at December 30, 2018 Net income Other comprehensive income (loss) Issuance of shares under stock plans Repurchase and retirement of common stock Share-based compensation Impact of adoption of ASC 842 related to leases Balances at December 29, 2019 21,840 21,843 (11,096,595) (11) (258,296) (258,307) 14,512 14,512 124,581,190 $ 124 $ 657,140 $ 1,134 $ (69,202) $ 149,629 589, 196 149,629 (5,816) (5,816) 822,586 1 4,877 4,878 (7,950,858) (8) (176,302) (176,310) 8,949 8,949 11,426 11,426 117,452,918 S 117 $ 670,966 $ (84,449) $ (4,682) $ 581,952
Step by Step Solution
There are 3 Steps involved in it
Step: 1

Get Instant Access to Expert-Tailored Solutions
See step-by-step solutions with expert insights and AI powered tools for academic success
Step: 2

Step: 3

Ace Your Homework with AI
Get the answers you need in no time with our AI-driven, step-by-step assistance
Get Started


