Answered step by step
Verified Expert Solution
Question
1 Approved Answer
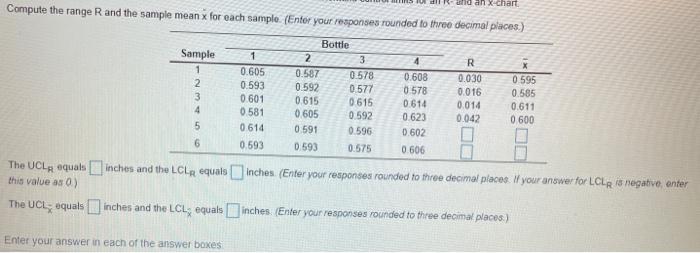
*you can ignore the bottom 2 pictures as they are the same as the ones on top 1 2 1 Aspen Plastics produces plastic bottles

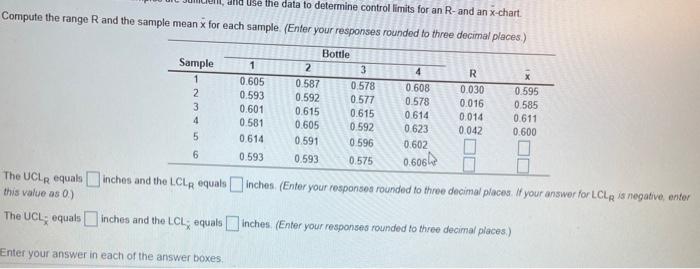
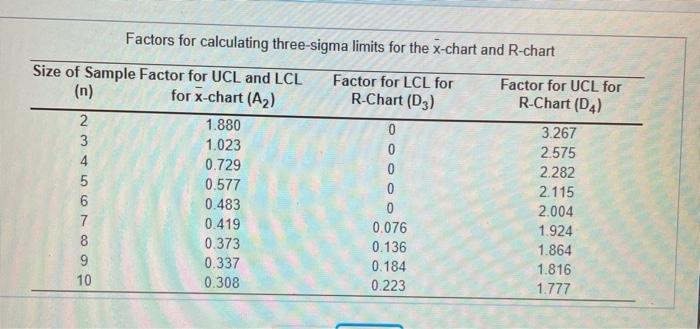
*you can ignore the bottom 2 pictures as they are the same as the ones on top
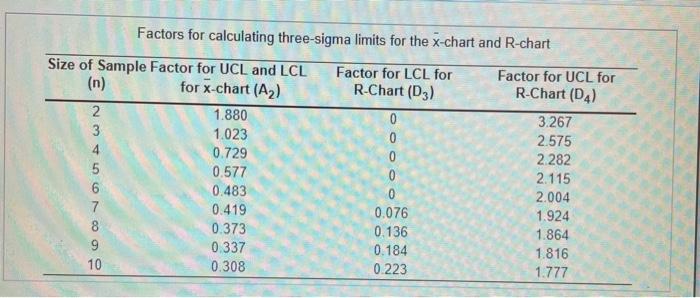
1 2 1 Aspen Plastics produces plastic bottles to customer order. The quality inspector randomly selects four bottles from the bottle machine and measures the outside diameter of the bottleneck, a critical quality dimension that determine whether the bottle cap will fit properly. The dimensions (in.) from the last six samples are Bottle Sample 3 4 0.605 0.587 0.578 0.608 2 0.593 0.592 0577 0.578 0.601 0615 0.615 0.614 0.581 0.605 0.592 0.623 0.614 0.591 0596 0.602 6 0.593 0.593 0.575 0.606 Click the icon to view the table of factors for calculating three-sigma limits for the x-chart and R.chart 3 4 5 Assume that only these six samples are sufficient and use the data to determine control limits for an R. and an x-chart Compute the range and the sample mean x for each sample. (Enter your responses rounded to three decimal places.) Compute the range R and the sample meanx for each sample. (Enter your responses rounded to three decimal places.) dan xchart Sample 1 2 3 4 1 0.605 0.593 0.601 0.581 0614 0,593 Bottle 2 3 0.587 0.578 0.592 0.577 0.615 0615 0.605 0.592 0591 0596 0.593 0.575 4 0.608 0578 0.614 0.623 0.602 0.606 R 0.030 0.016 0.014 0.042 0595 0.585 0.611 0.600 5 6 The UCLA quals inches and the LCLR equals Inches (Enter your responsed rounded to three decimal places. If your answer for LCLR is negative, enter this value as 0 ) The UCL equals) inches and the LCL; equals inches (Enter your responses rounded to three decimal places:) Enter your answer in each of the answer boxes Factors for calculating three-sigma limits for the x-chart and R-chart Size of Sample Factor for UCL and LCL Factor for LCL for Factor for UCL for (n) for x-chart (A2) R-Chart (D3) R-Chart (14) 2 1.880 3.267 3 1.023 2.575 4 0.729 2.282 5 0.577 0 2.115 0.483 0 2.004 7 0.419 0.076 1.924 8 0.373 0.136 1.864 9 0.337 0.184 1.816 10 0.308 0.223 1.777 O O O O and use the data to determine control limits for an R-and an x-chart. Compute the range R and the sample mean x for each sample. (Enter your responses rounded to three decimal places.) Sample 1 2 3 4 5 6 1 0.605 0.593 0.601 0.581 0.614 0.593 Bottle 2 3 0.587 0.578 0.592 0.577 0.615 0.615 0.605 0.592 0.591 0.596 0.593 0.575 4 0.608 0.578 0.614 0.623 0.602 R 0.030 0.016 0014 0.042 0.595 0.585 0.611 0.600 0.606 The UCLR equals inches and the LCLR equals inches (Enter your responses rounded to three decimal places. If your answer for LCLR is negative, enter this value as 0.) The UCL; equals inches and the LCL equals inches (Enter your responses rounded to three decimal places) Enter your answer in each of the answer boxes Factors for calculating three-sigma limits for the x-chart and R-chart Size of Sample Factor for UCL and LCL Factor for LCL for Factor for UCL for (n) for x-chart (A2) R-Chart (D3) R-Chart (14) 2 1.880 0 3.267 3 1.023 0 2.575 0.729 0 2.282 0.577 0 2.115 6 0.483 0 2.004 7 0.419 0.076 1.924 8 0.373 0.136 1.864 9 0.337 0.184 1.816 10 0.308 0.223 1.777 1 2 1 Aspen Plastics produces plastic bottles to customer order. The quality inspector randomly selects four bottles from the bottle machine and measures the outside diameter of the bottleneck, a critical quality dimension that determine whether the bottle cap will fit properly. The dimensions (in.) from the last six samples are Bottle Sample 3 4 0.605 0.587 0.578 0.608 2 0.593 0.592 0577 0.578 0.601 0615 0.615 0.614 0.581 0.605 0.592 0.623 0.614 0.591 0596 0.602 6 0.593 0.593 0.575 0.606 Click the icon to view the table of factors for calculating three-sigma limits for the x-chart and R.chart 3 4 5 Assume that only these six samples are sufficient and use the data to determine control limits for an R. and an x-chart Compute the range and the sample mean x for each sample. (Enter your responses rounded to three decimal places.) Compute the range R and the sample meanx for each sample. (Enter your responses rounded to three decimal places.) dan xchart Sample 1 2 3 4 1 0.605 0.593 0.601 0.581 0614 0,593 Bottle 2 3 0.587 0.578 0.592 0.577 0.615 0615 0.605 0.592 0591 0596 0.593 0.575 4 0.608 0578 0.614 0.623 0.602 0.606 R 0.030 0.016 0.014 0.042 0595 0.585 0.611 0.600 5 6 The UCLA quals inches and the LCLR equals Inches (Enter your responsed rounded to three decimal places. If your answer for LCLR is negative, enter this value as 0 ) The UCL equals) inches and the LCL; equals inches (Enter your responses rounded to three decimal places:) Enter your answer in each of the answer boxes Factors for calculating three-sigma limits for the x-chart and R-chart Size of Sample Factor for UCL and LCL Factor for LCL for Factor for UCL for (n) for x-chart (A2) R-Chart (D3) R-Chart (14) 2 1.880 3.267 3 1.023 2.575 4 0.729 2.282 5 0.577 0 2.115 0.483 0 2.004 7 0.419 0.076 1.924 8 0.373 0.136 1.864 9 0.337 0.184 1.816 10 0.308 0.223 1.777 O O O O and use the data to determine control limits for an R-and an x-chart. Compute the range R and the sample mean x for each sample. (Enter your responses rounded to three decimal places.) Sample 1 2 3 4 5 6 1 0.605 0.593 0.601 0.581 0.614 0.593 Bottle 2 3 0.587 0.578 0.592 0.577 0.615 0.615 0.605 0.592 0.591 0.596 0.593 0.575 4 0.608 0.578 0.614 0.623 0.602 R 0.030 0.016 0014 0.042 0.595 0.585 0.611 0.600 0.606 The UCLR equals inches and the LCLR equals inches (Enter your responses rounded to three decimal places. If your answer for LCLR is negative, enter this value as 0.) The UCL; equals inches and the LCL equals inches (Enter your responses rounded to three decimal places) Enter your answer in each of the answer boxes Factors for calculating three-sigma limits for the x-chart and R-chart Size of Sample Factor for UCL and LCL Factor for LCL for Factor for UCL for (n) for x-chart (A2) R-Chart (D3) R-Chart (14) 2 1.880 0 3.267 3 1.023 0 2.575 0.729 0 2.282 0.577 0 2.115 6 0.483 0 2.004 7 0.419 0.076 1.924 8 0.373 0.136 1.864 9 0.337 0.184 1.816 10 0.308 0.223 1.777 Step by Step Solution
There are 3 Steps involved in it
Step: 1

Get Instant Access to Expert-Tailored Solutions
See step-by-step solutions with expert insights and AI powered tools for academic success
Step: 2

Step: 3

Ace Your Homework with AI
Get the answers you need in no time with our AI-driven, step-by-step assistance
Get Started


