You can use excel for calculation.
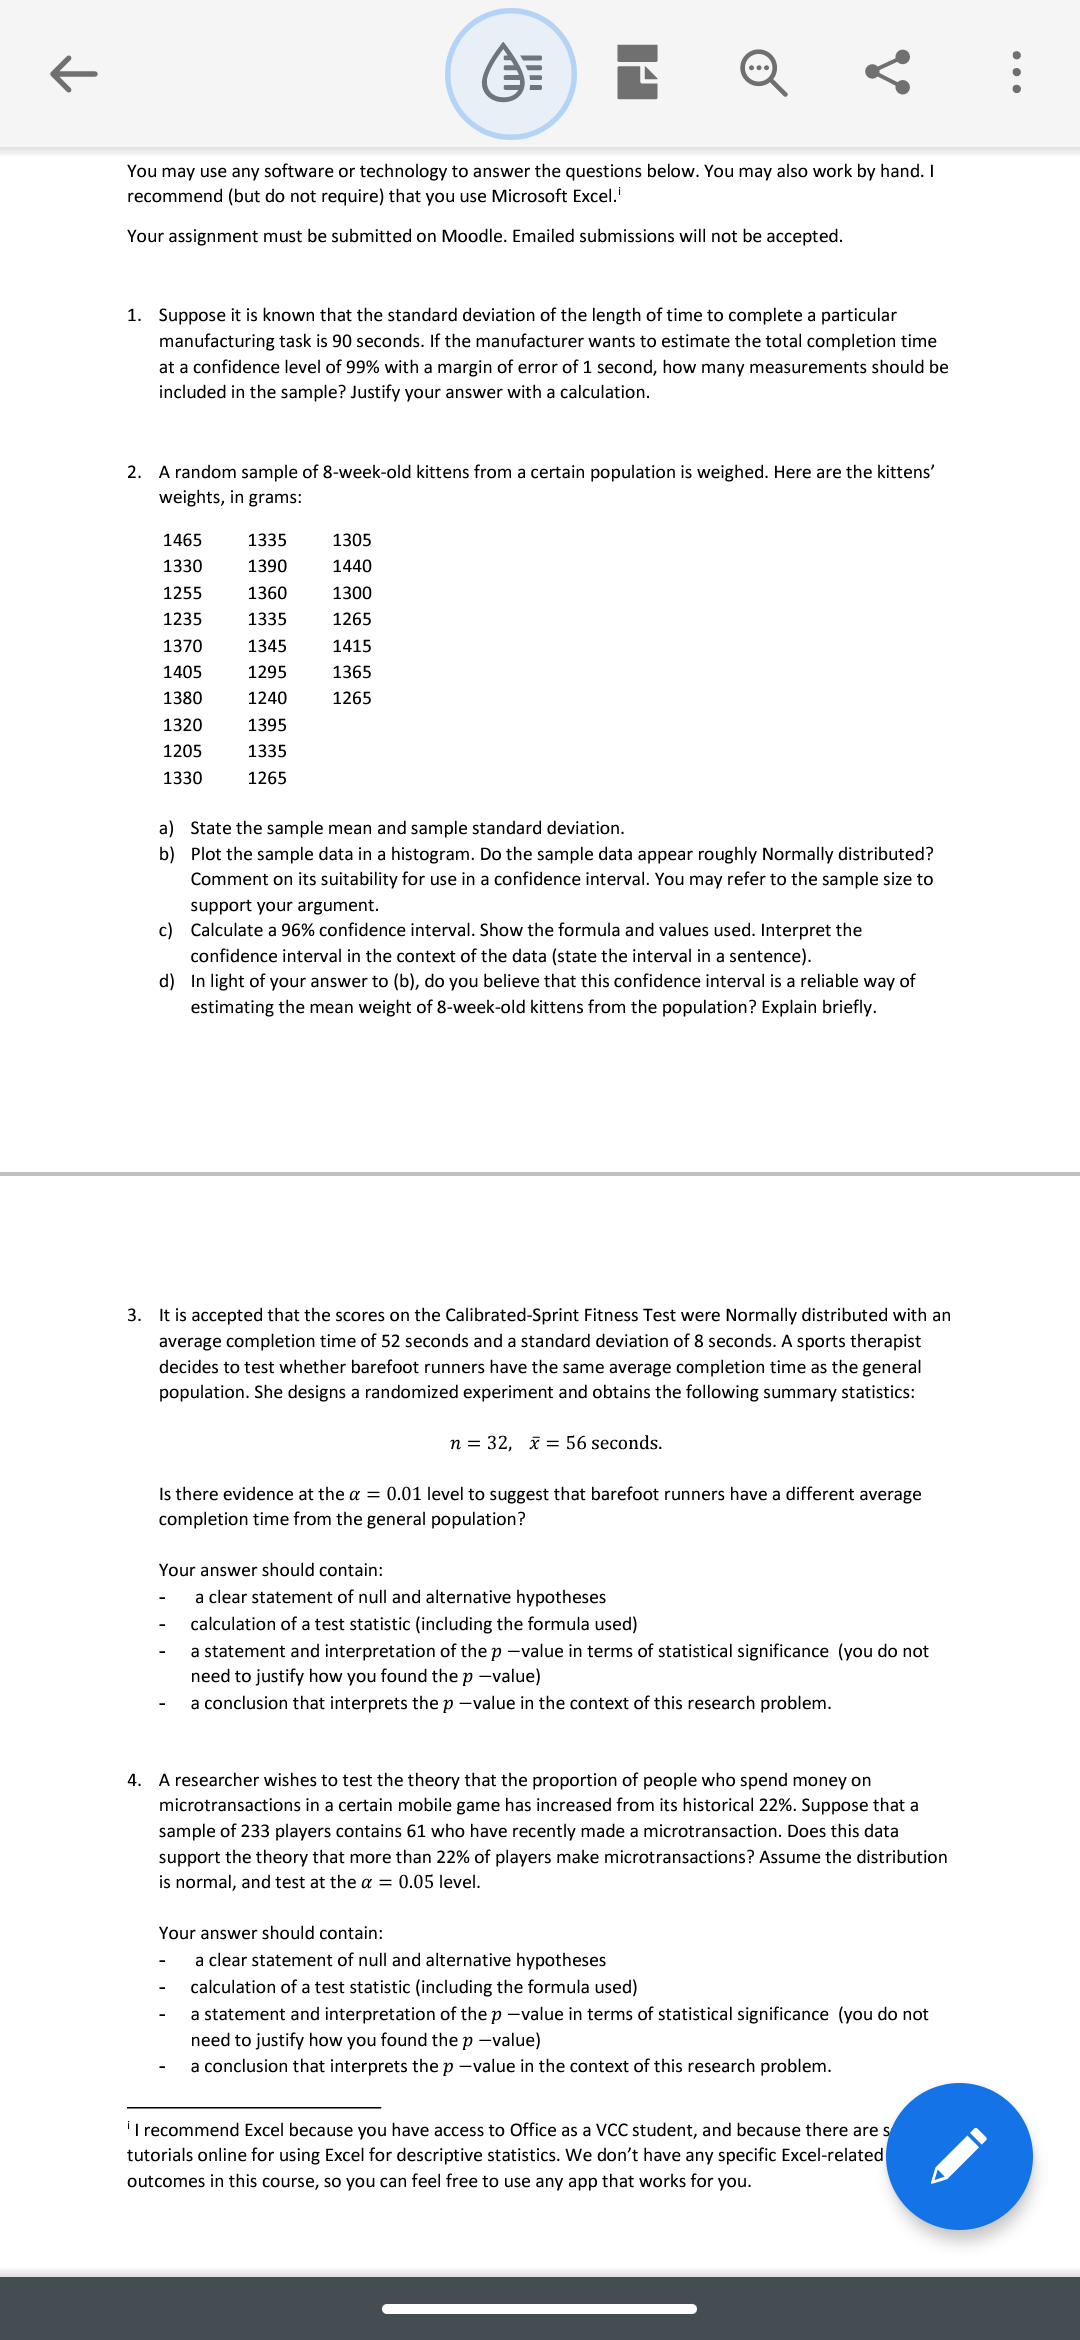
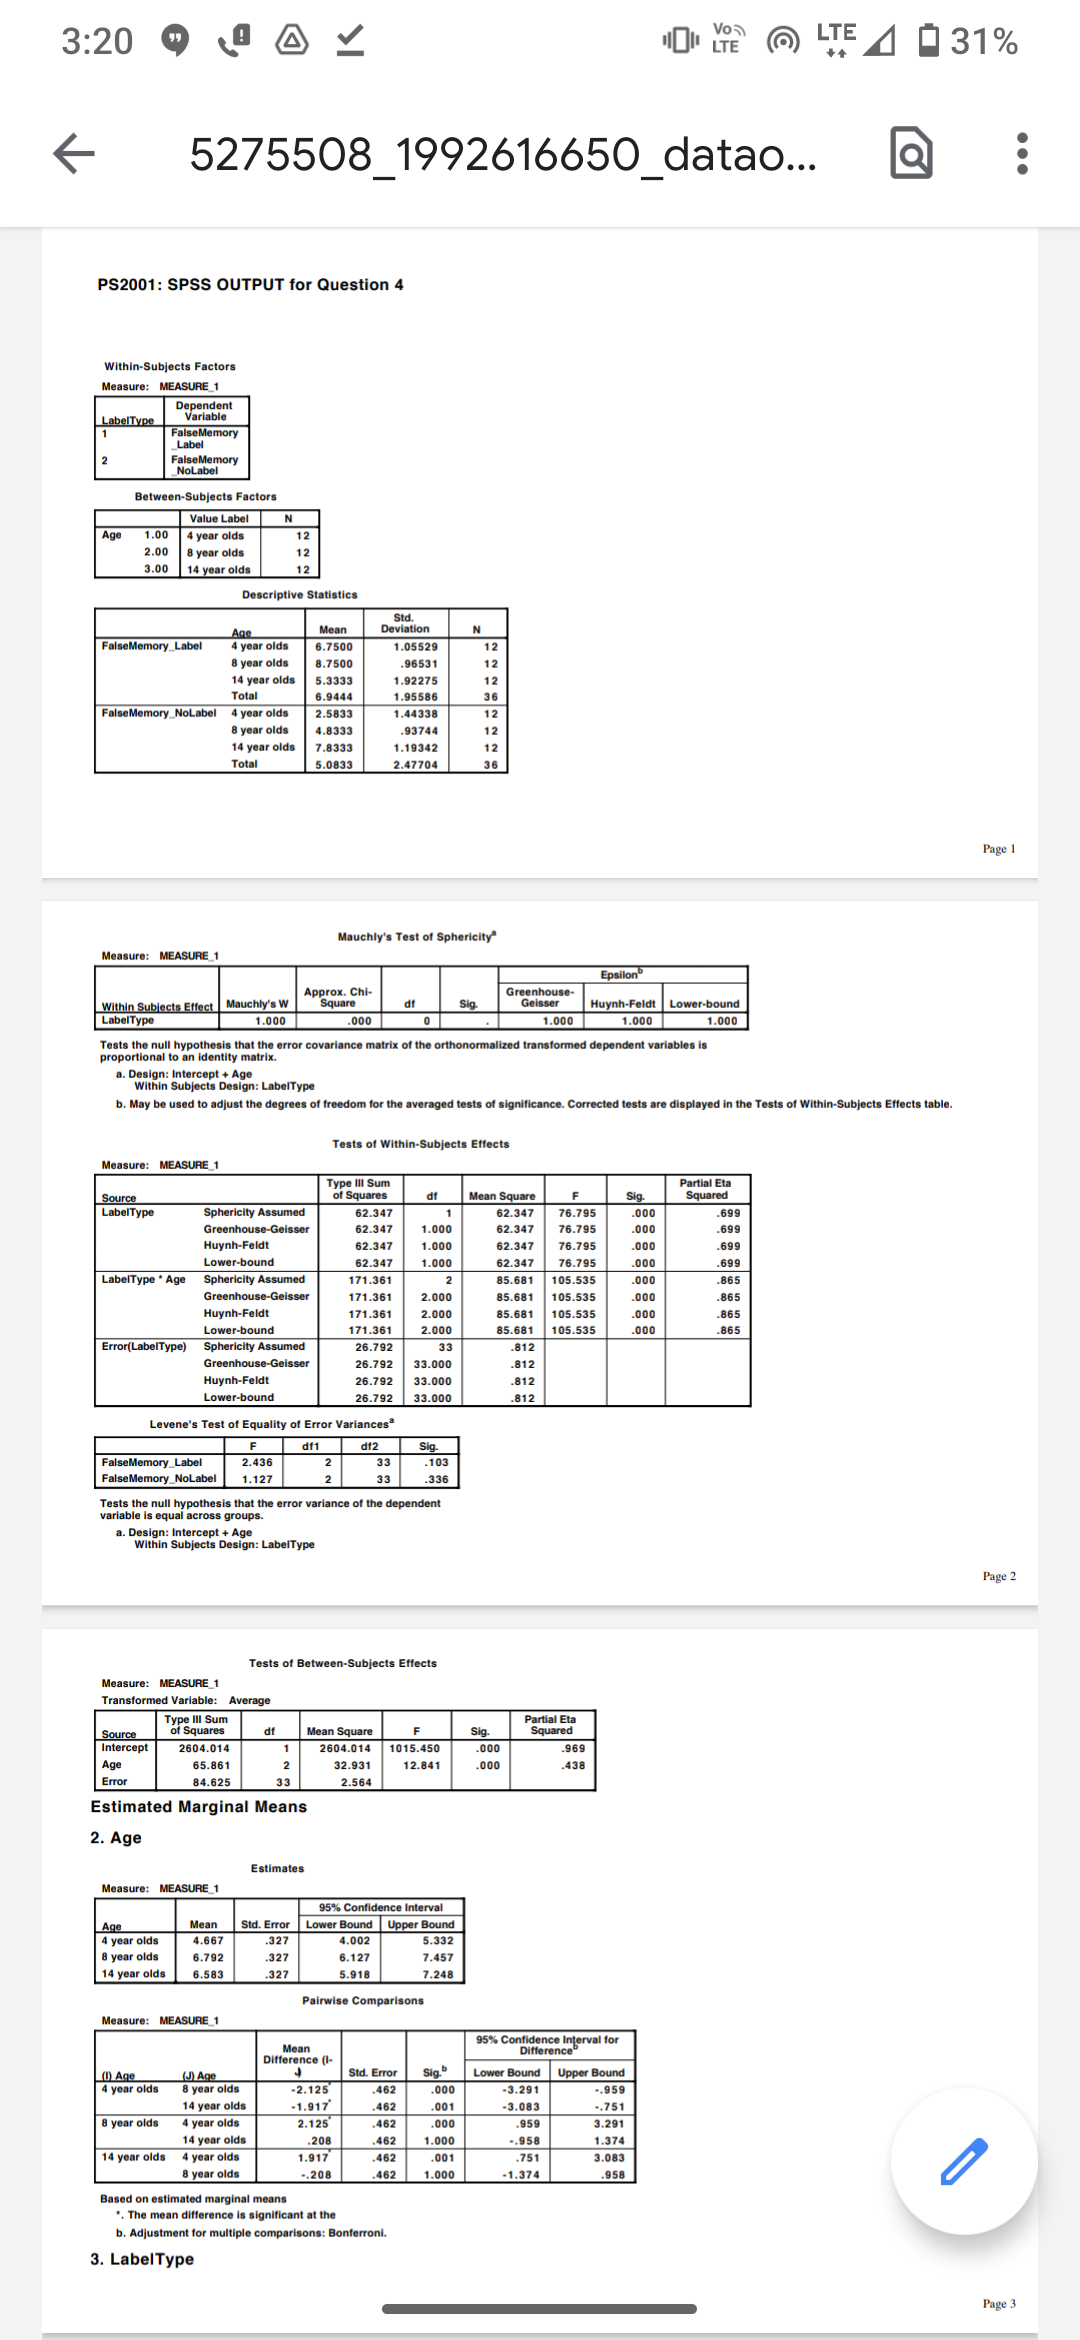
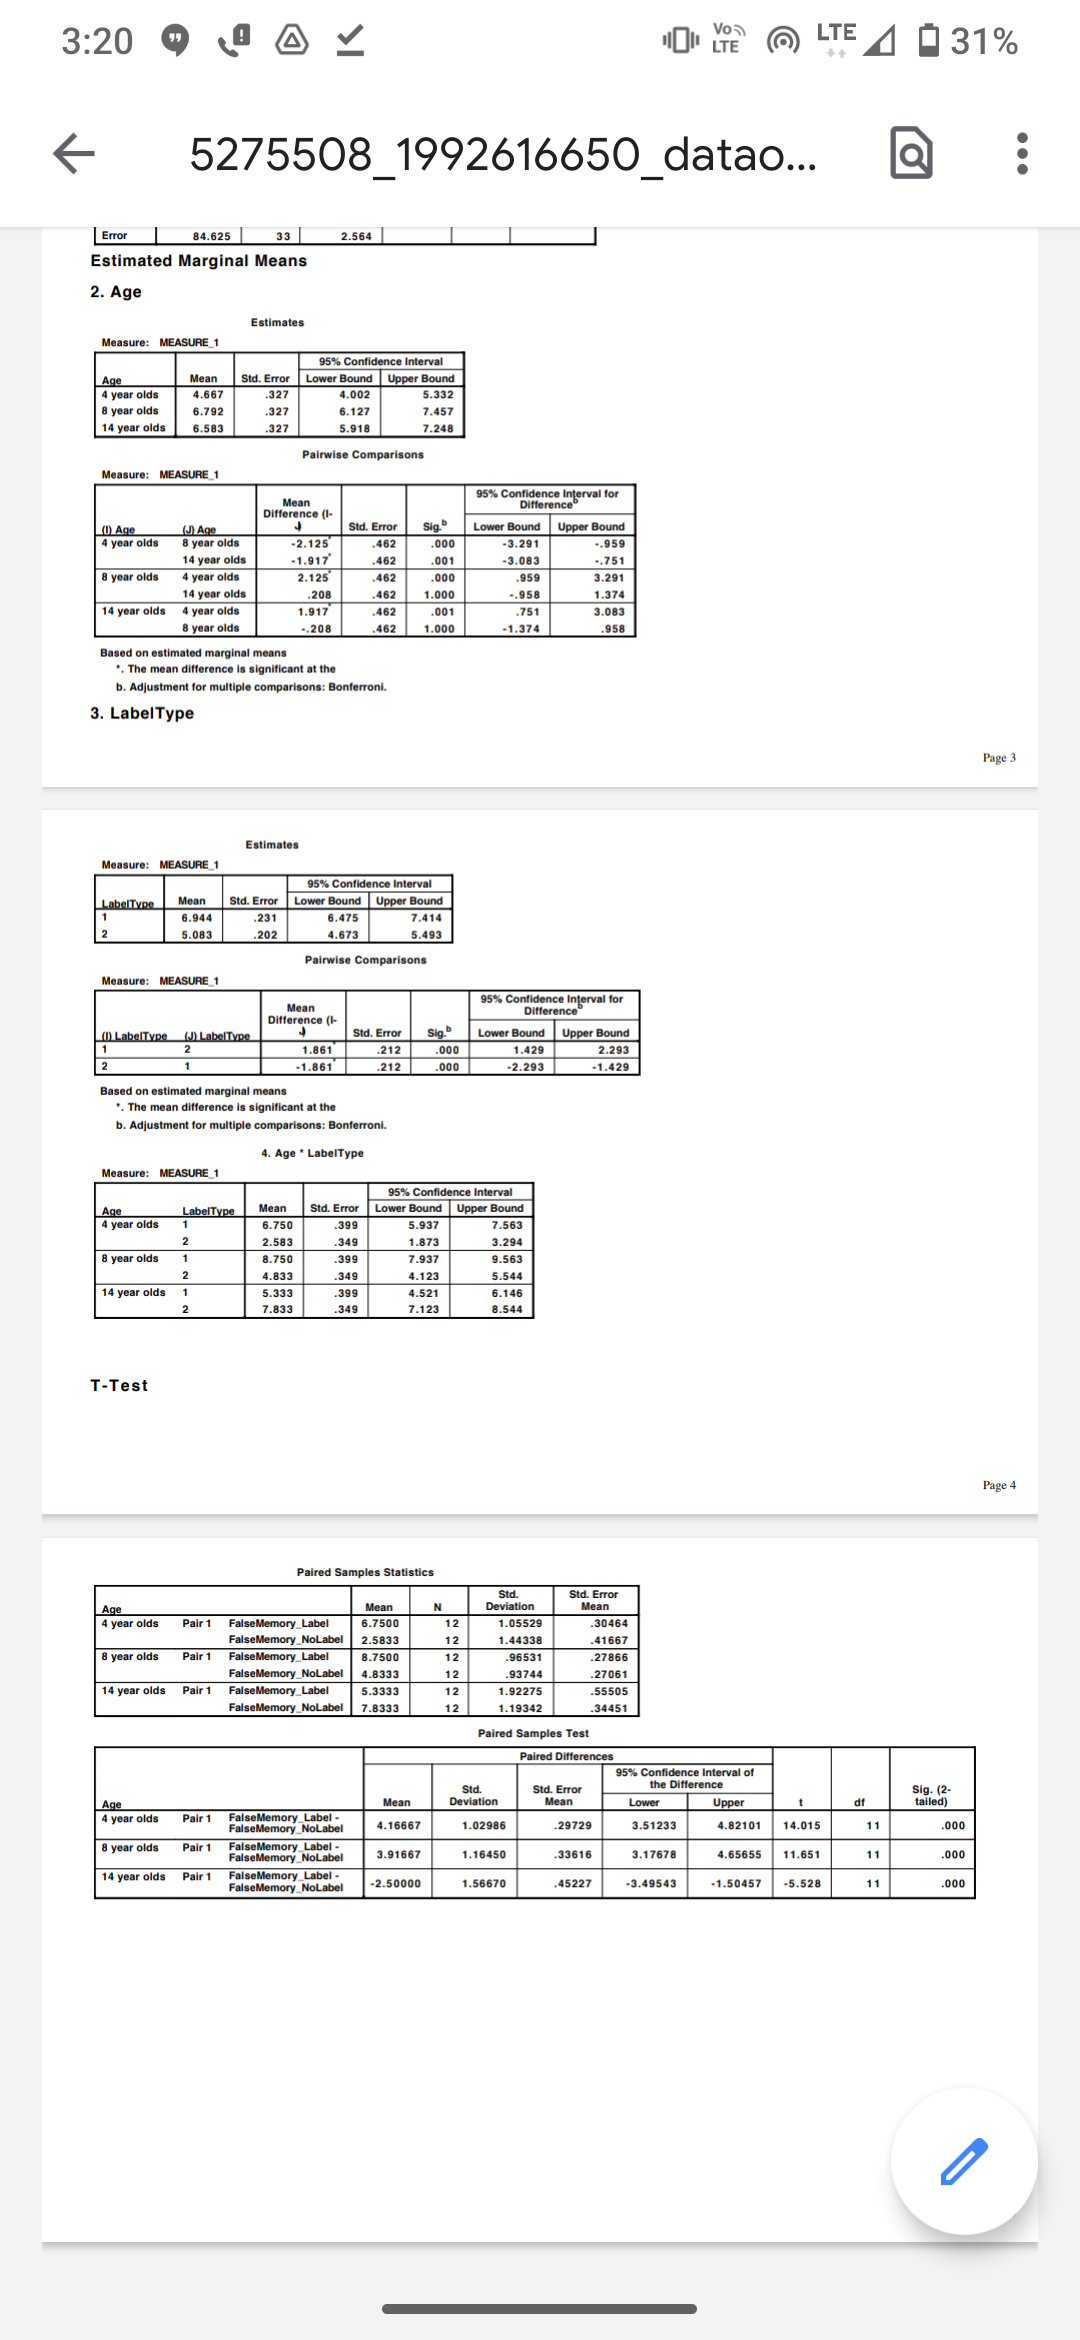
. . . You may use any software or technology to answer the questions below. You may also work by hand. I recommend (but do not require) that you use Microsoft Excel.' Your assignment must be submitted on Moodle. Emailed submissions will not be accepted. 1. Suppose it is known that the standard deviation of the length of time to complete a particular manufacturing task is 90 seconds. If the manufacturer wants to estimate the total completion time at a confidence level of 99% with a margin of error of 1 second, how many measurements should be included in the sample? Justify your answer with a calculation. 2. A random sample of 8-week-old kittens from a certain population is weighed. Here are the kittens' weights, in grams: 1465 1335 1305 1330 1390 1440 1255 1360 1300 1235 1335 1265 137 1345 1415 1405 1295 1365 1380 1240 1265 1320 1395 1205 1335 1330 1265 a) State the sample mean and sample standard deviation. b) Plot the sample data in a histogram. Do the sample data appear roughly Normally distributed? Comment on its suitability for use in a confidence interval. You may refer to the sample size to support your argument. c) Calculate a 96% confidence interval. Show the formula and values used. Interpret the confidence interval in the context of the data (state the interval in a sentence). d) In light of your answer to (b), do you believe that this confidence interval is a reliable way of estimating the mean weight of 8-week-old kittens from the population? Explain briefly. 3. It is accepted that the scores on the Calibrated-Sprint Fitness Test were Normally distributed with an average completion time of 52 seconds and a standard deviation of 8 seconds. A sports therapist decides to test whether barefoot runners have the same average completion time as the general population. She designs a randomized experiment and obtains the following summary statistics: n = 32, x = 56 seconds. Is there evidence at the a = 0.01 level to suggest that barefoot runners have a different average completion time from the general population? Your answer should contain: a clear statement of null and alternative hypotheses calculation of a test statistic (including the formula used) a statement and interpretation of the p -value in terms of statistical significance (you do not need to justify how you found the p -value) a conclusion that interprets the p -value in the context of this research problem. 4. A researcher wishes to test the theory that the proportion of people who spend money on microtransactions in a certain mobile game has increased from its historical 22%. Suppose that a sample of 233 players contains 61 who have recently made a microtransaction. Does this data support the theory that more than 22% of players make microtransactions? Assume the distribution is normal, and test at the a = 0.05 level. Your answer should contain: a clear statement of null and alternative hypotheses calculation of a test statistic (including the formula used) a statement and interpretation of the p -value in terms of statistical significance (you do not need to justify how you found the p -value) a conclusion that interprets the p -value in the context of this research problem. I recommend Excel because you have access to Office as a VCC student, and because there are s tutorials online for using Excel for descriptive statistics. We don't have any specific Excel-related outcomes in this course, so you can feel free to use any app that works for you.Statistics ANOVA. - Please complete in APA style. In an experimental test of false memory development children aged 4, B, and 14 were presented with DRM lists. False memory production is believed to increase when children are told the category label of the list (for example, the la- bel might be furniture, with the critical lure: chair, and list items: table, stool, sofa, etc.) The experiment was designed to see if providing the category labels helps younger children produce more false memories because it helps them see the association between the words on the list (table, stool, sofa) and the unseen critical lure (chair). The data provided are number of false memories produced (out of 1 n) in each label condition. What was the design of the study, in terms of within- and between-subjects factors. and levels? (10 marks) Was the assumption of equality of variance met in these data? How can you tell? (15 marks) What does Mauchly's test of sphericity analyse, and what can you say about the value provided? (1 0 marks) What other parametric assumptions should you consider. and how oould you ensure you have met these assumptions? (1 0 marks) Write a paragraph to report the results of the ANOVA in the appropriate format explaining what effects were signicant (20 marks) Explain in words what is happening to produce a signicant interaction (15 marks) In APA format, report the results of the additional analyses that were run to support an interpretation of the interaction. Comment on what the results show (20 marks) 5275507_121262671_StatistiCSANOVAquest 3:20 " BAY 10 LTE ) LTE LTE 31% 5275508_1992616650_datao... Q .. . PS2001: SPSS OUTPUT for Question 4 Within-Subjects Factors Measure: MEASURE_1 Dependent LabelType Variable FalseMemory FalseMemory NoLabel Between-Subjects Factors Value Label N Age 1.00 4 year olds 12 2.00 8 year olds 3.00 14 year olds 12 Descriptive Statistics Std. Age Mean Deviation FalseMemory_Label 4 year olds 6.7500 1.05529 8 year olds 8.7500 .96531 14 year olds 5.3333 1.92275 Total 6.9444 1.95586 FalseMemory_NoLabel 4 year olds 2.5833 1.4433 12 8 year olds 4.8333 .93744 14 year olds 7.8333 1.19342 Total 5.0833 2.47704 Page 1 Mauchly's Test of Sphericity" Measure: MEASURE_1 Epsilon Approx. Chi- reenhouse- Within Subjects Effect Mauchly's W Square df Geisser Huynh-Feldt Lower-bound LabelType 1.000 .000 1.000 1.000 1.000 Tests the null hypothesis that the error covariance matrix of the orthono ized transformed dependent variables is proportional to an identity matrix. Design: Intercept + Age Within Subjects Design: LabelType b. May be used to adjust the degrees of freedom for the averaged tests of significance. Corrected tests are displayed in the Tests of Within-Subjects Effects table. Tests of Within-Subjects Effects Measure: MEASURE_1 Type Ill Sum Partial Eta Source Mean Square LabelType Sphericity Assumed 62.347 62.347 76.795 .000 .699 Greenhouse-Geisser $2.347 1.000 62.347 76.795 .000 .699 Huynh-Feldt 62.347 1.000 62.347 76.795 .000 699 Lower-bound 62.347 1.000 62.347 76.795 .000 699 LabelType * Age Sphericity Assumed 171.361 85.681 105.535 .090 .865 Greenhouse-Geisser 171.361 2.00 85.681 105.535 .000 865 Huynh-Feldt 71.361 2.000 85.681 105.535 .000 865 Lower-bound 171.361 2.000 85.681 105.535 .000 865 Error(LabelType) Sphericity Assumed 26.792 33 .812 Gree house-Geisser 26.792 33.000 Huynh-Feld 26.792 33.000 812 Lower-bound 26.792 33.000 .812 evene's Test of Equality of Error Variances" df1 d12 Sig. FalseMemory_Label 2.436 33 .103 FalseMemory_NoLabel 1.127 33 .336 Tests the null hypothesis that the error variance of the depend variable is equal across groups a. Design: Intercept + Age Within Subjects Design: LabelType Page 2 Tests of Between-Subjects Effects Measure: MEASURE_1 Transformed Variable: Average Type Ill Sum Mean Square Partial Eta Source df sig. Intercept 2604.014 2604.014 1015.450 .000 .969 Age 65.861 32.931 12.841 .090 438 Error 84.625 2.564 Estimated Marginal Means 2. Age Estimates Measure: MEASURE 95% Confidence Interval Age Mean Std. Error Lower Bound Upper Bound 4 year olds 4.667 .327 4.002 5.332 8 year olds 6.792 .327 6.127 7.457 14 year olds 6.583 .327 5.918 7.248 Pairwise Comparisons Measure: MEASURE_1 95% Confidence Interval for Difference (1- Difference (1) Age (J) Age Std. Error Sig. ower Bound Upper Bound 4 year olds 8 year olds .2.125 .462 .000 -3.291 -.959 14 year olds -1.917' 462 .001 -3.083 -.751 8 year olds 4 year olds 2.125 462 .000 .959 3.291 14 year olds .208 .462 1.000 .958 1.374 14 year olds 4 year olds 1.917 .462 .001 .751 3.083 -.208 462 1.000 -1.374 .958 Based on estimated marginal means *. The mean difference is significant at the b. Adjustment for multiple comparisons: Bonferroni. 3. LabelType Page 33:20 " BAY 1 LTE ) LTE 4 031% 5275508_1992616650_datao... Q .. . Error 84.625 33 2.564 Estimated Marginal Means 2. Age Estimates Measure: MEASURE 95% Confidence Interval Age Mean Std. Error Lower Bound Upper Bound 4 year olds 4.667 .327 4.002 5.332 8 year olds 6.792 .327 6.127 7.457 14 year olds 6.583 .327 5.918 7.248 Pairwise Comparisons Measure: MEASURE_1 Mean 5% Confidence Interval for Difference (1- Difference (1) Age (J) Age Std. Error Sig.D Lower Bound Upper Bound 4 year olds 8 year olds -2.125 .462 .000 -3.291 -.959 14 year olds -1.917 462 .001 -3.083 -.751 8 year olds 4 year olds 2.125 462 .000 .959 3.291 14 year olds .208 462 1.000 -.958 1.374 14 year olds 4 year olds 1.917 .462 .001 .751 3.083 8 year old -.208 .462 1.000 -1.374 .958 Based on estimated marginal means *. The mean difference is significant at the b. Adjustment for mparisons: Bonferroni. 3. LabelType Page 3 Estimates Measure: MEASURE 95% Confidence Interval LabelType Mean Std. Error Lower Bound Upper Bound 6.944 .231 6.475 7.414 5.083 202 4.673 5.493 Pairwise Comparisons Measure: MEASURE_1 95% Confidence Interval for Mean Difference (1- Difference (1) LabelType (J) LabelType Std. Error Sig. Lower Bound Upper Bound 1.861 .212 .000 1.429 2.293 -1.861 -212 .000 -2.293 -1.429 Based on estimated marginal means . The mean difference is s anificant at the b. Adjustment for multiple comparisons: Bonferroni. 4. Age * LabelType Measure: MEASURE_1 95% Confidence Interval Age LabelType Mean td. Error Lower Bound Upper Bound 4 year olds 6.750 .399 5.937 7.563 2.583 .349 1.873 3.294 8 year olds 8.750 .399 7.937 9.563 N - 4.833 .349 4.123 5.544 14 year olds 5.333 -399 4.521 6.146 2 7.833 .349 7.123 8.544 T-Test Page 4 Paired Samples Statistics Std. Std. Error Age Mean Deviation Mean 4 year olds Pair 1 FalseMemory_Label 6.7500 12 1.05529 .30464 FalseMemory_NoLabel 2.5833 12 1.44338 41667 8 year olds Pair 1 FalseMemory_Label 8.7500 -96531 27866 FalseMemory_NoLabel 4.8333 .93744 27061 14 year olds Pair 1 FalseMemory_Label 5.3333 1.92275 55505 FalseMemory_NoLabe 7.8333 1.19342 34451 Paired Samples Test Paired Differences 95% Confidence Interval of Std. Std. Error the Difference ig. (2 Age Deviation Upper df alled 4 year olds Pair 1 alseMemory_Nola 4.16667 1.02986 29729 3.51233 4.82101 14.015 11 .000 8 year olds Pair 1 FalseMemory_Label FalseMemory_NoLabe 3.91667 1.16450 33616 3.17678 4.65655 11.651 11 000 14 year olds Pair 1 FalseMemory_Label - FalseMemory_NoLabel -2.50000 1.56670 45227 -3.49543 1.50457 -5.528 11 000