You decide to invest in stock in a particular type of company and set the guideline that
you will only buy stock in companies that are ranked in the 80th percentile or above in
term of dividends paid in the previous year. You are looking at a company that ranked
24 of 89 companies that paid dividends in 2019.
a. Will this company qualify for your portfolio?
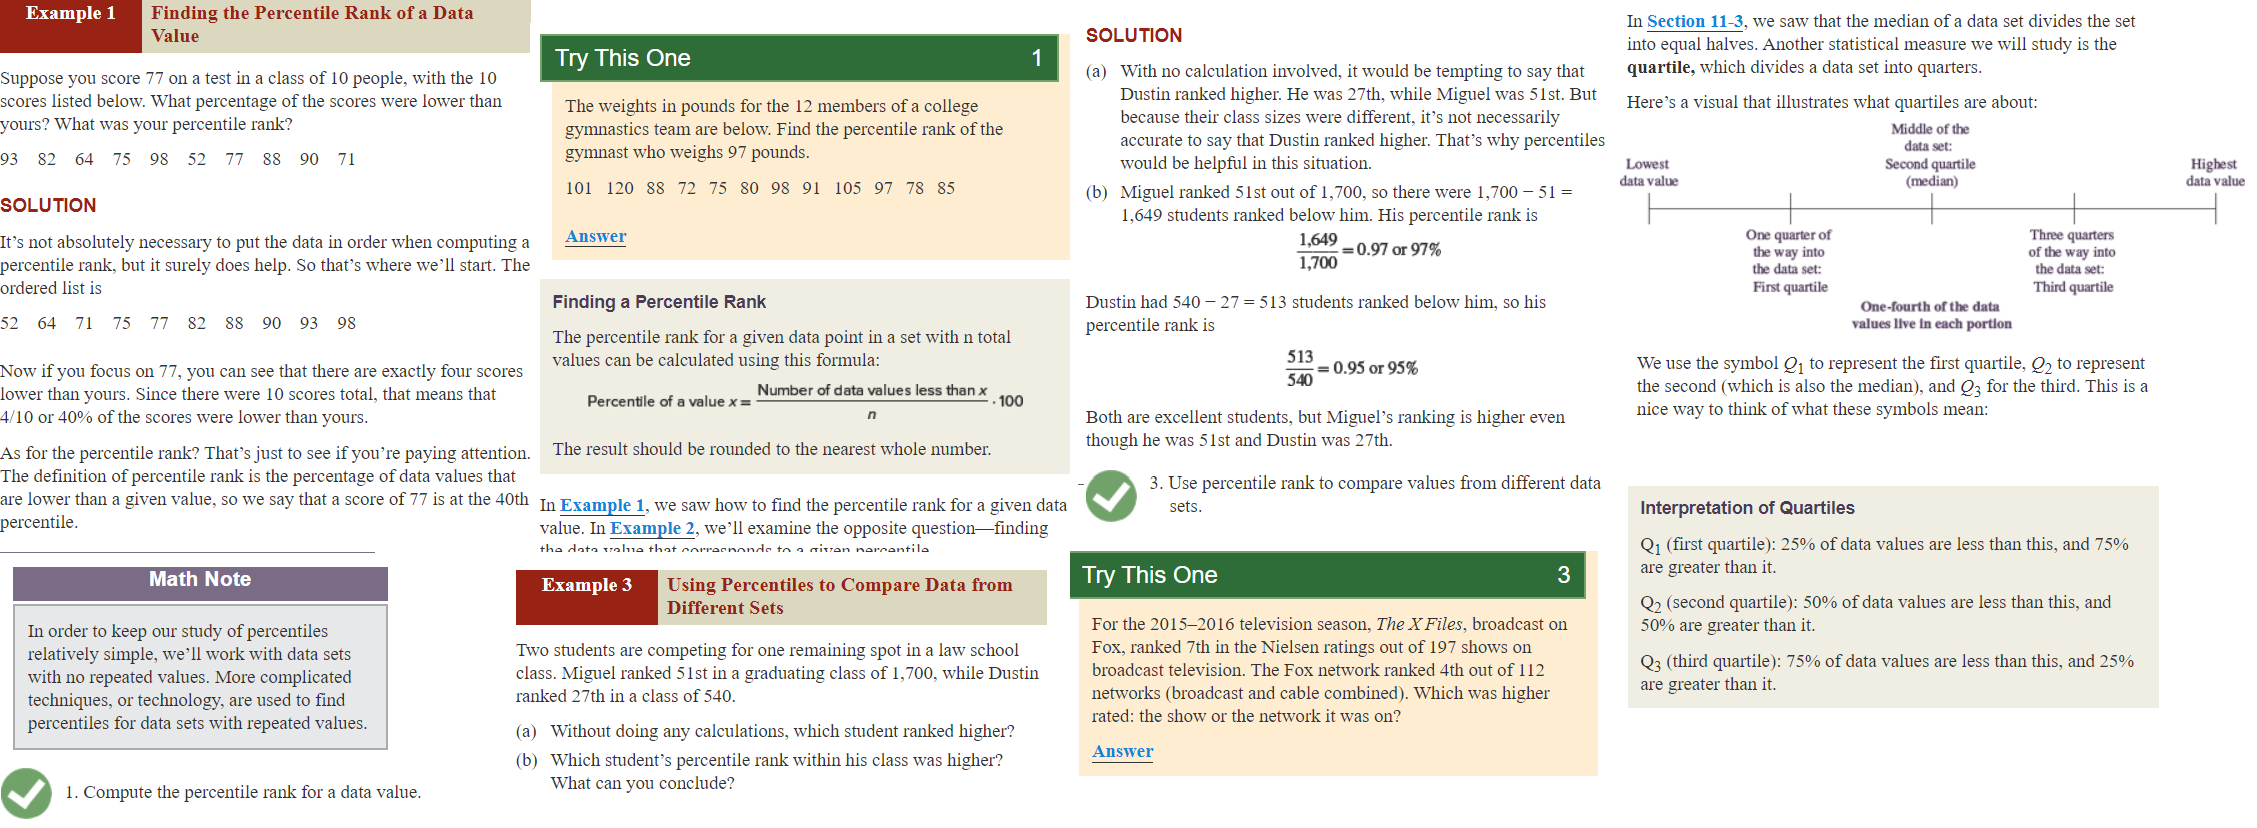
I already got this answer wrong, but now I have to fix it and don't know how, the professor's advice is as follows. Part 1 a is about percentiles. Section 11-5 pages 687 - 689 example 1 gives the rule and example 3 shows its application. Attached in the pictures is the example 1 and example 3. I do not understand how I am supposed to use that with my information. I need this worked out STEP BY STEP, and VERY NEATLY so I can understand how to lay the formula out properly. Typed out would be even more amazing.
Example 1 Finding the Percentile Rank of a Data In Section 11-3, we saw that the median of a data set divides the set Value SOLUTION Try This One into equal halves. Another statistical measure we will study is the Suppose you score 77 on a test in a class of 10 people, with the 10 (a) With no calculation involved, it would be tempting to say that quartile, which divides a data set into quarters. cores listed below. What percentage of the scores were lower than The weights in pounds for the 12 members of a college Dustin ranked higher. He was 27th, while Miguel was 51st. But Here's a visual that illustrates what quartiles are about: yours? What was your percentile rank? gymnastics team are below. Find the percentile rank of the because their class sizes were different, it's not necessarily accurate to say that Dustin ranked higher. That's why percentiles Middle of the data set: 93 82 64 75 98 52 77 88 90 71 gymnast who weighs 97 pounds. would be helpful in this situation. Lowest Second quartile Highest 101 120 88 72 75 80 98 91 105 97 78 85 SOLUTION (b) Miguel ranked 51st out of 1,700, so there were 1,700 - 51 = data value (median) data value 1,649 students ranked below him. His percentile rank is It's not absolutely necessary to put the data in order when computing a Answer 1,649 = 0.97 or 97% One quarter of Three quarters 1,700 the way into of the way into percentile rank, but it surely does help. So that's where we'll start. The the data set: the data set: ordered list is First quartile Third quartile Finding a Percentile Rank Dustin had 540 - 27 = 513 students ranked below him, so his One-fourth of the data 2 64 71 75 77 82 88 90 93 98 percentile rank is values live in each portion The percentile rank for a given data point in a set with n total Now if you focus on 77, you can see that there are exactly four scores values can be calculated using this formula: 513 540 = 0.95 or 95% We use the symbol @1 to represent the first quartile, @2 to represent lower than yours. Since there were 10 scores total, that means that Number of data values less than x _ the second (which is also the median), and @3 for the third. This is a Percentile of a value x = 4/10 or 40% of the scores were lower than yours. Both are excellent students, but Miguel's ranking is higher even nice way to think of what these symbols mean: The result should be rounded to the nearest whole number. though he was 51st and Dustin was 27th. As for the percentile rank? That's just to see if you're paying attention. The definition of percentile rank is the percentage of data values that 3. Use percentile rank to compare values from different data are lower than a given value, so we say that a score of 77 is at the 40th In Example 1, we saw how to find the percentile rank for a given data sets. Interpretation of Quartiles percentile. value. In Example 2, we'll examine the opposite question-finding the data value that aorrasnonde to a mition narcantila Q1 (first quartile): 25% of data values are less than this, and 75% Math Note Example 3 Using Percentiles to Compare Data from Try This One 3 are greater than it. Different Sets Q2 (second quartile): 50% of data values are less than this, and In order to keep our study of percentiles For the 2015-2016 television season, The X Files, broadcast on 50% are greater than it. relatively simple, we'll work with data sets Two students are competing for one remaining spot in a law school Fox, ranked 7th in the Nielsen ratings out of 197 shows on with no repeated values. More complicated class. Miguel ranked 51st in a graduating class of 1, 700, while Dustin broadcast television. The Fox network ranked 4th out of 112 Q3 (third quartile): 75% of data values are less than this, and 25% ranked 27th in a class of 540. networks (broadcast and cable combined). Which was higher are greater than it. techniques, or technology, are used to find percentiles for data sets with repeated values. rated: the show or the network it was on? (a) Without doing any calculations, which student ranked higher? (b) Which student's percentile rank within his class was higher? Answer . Compute the percentile rank for a data value. What can you conclude