

Question
You decided to join a fantasy Baseball league and you think the best way to pick your players is to look at their Batting Averages.
You decided to join a fantasy Baseball league and you think the best way to pick your players is to look at their Batting Averages.
You want to use data from the previous season to help predict Batting Averages to know which players to pick for the upcoming season. You want to use Runs Score, Doubles, Triples, Home Runs and Strike Outs to determine if there is a significant linear relationship for Batting Averages.
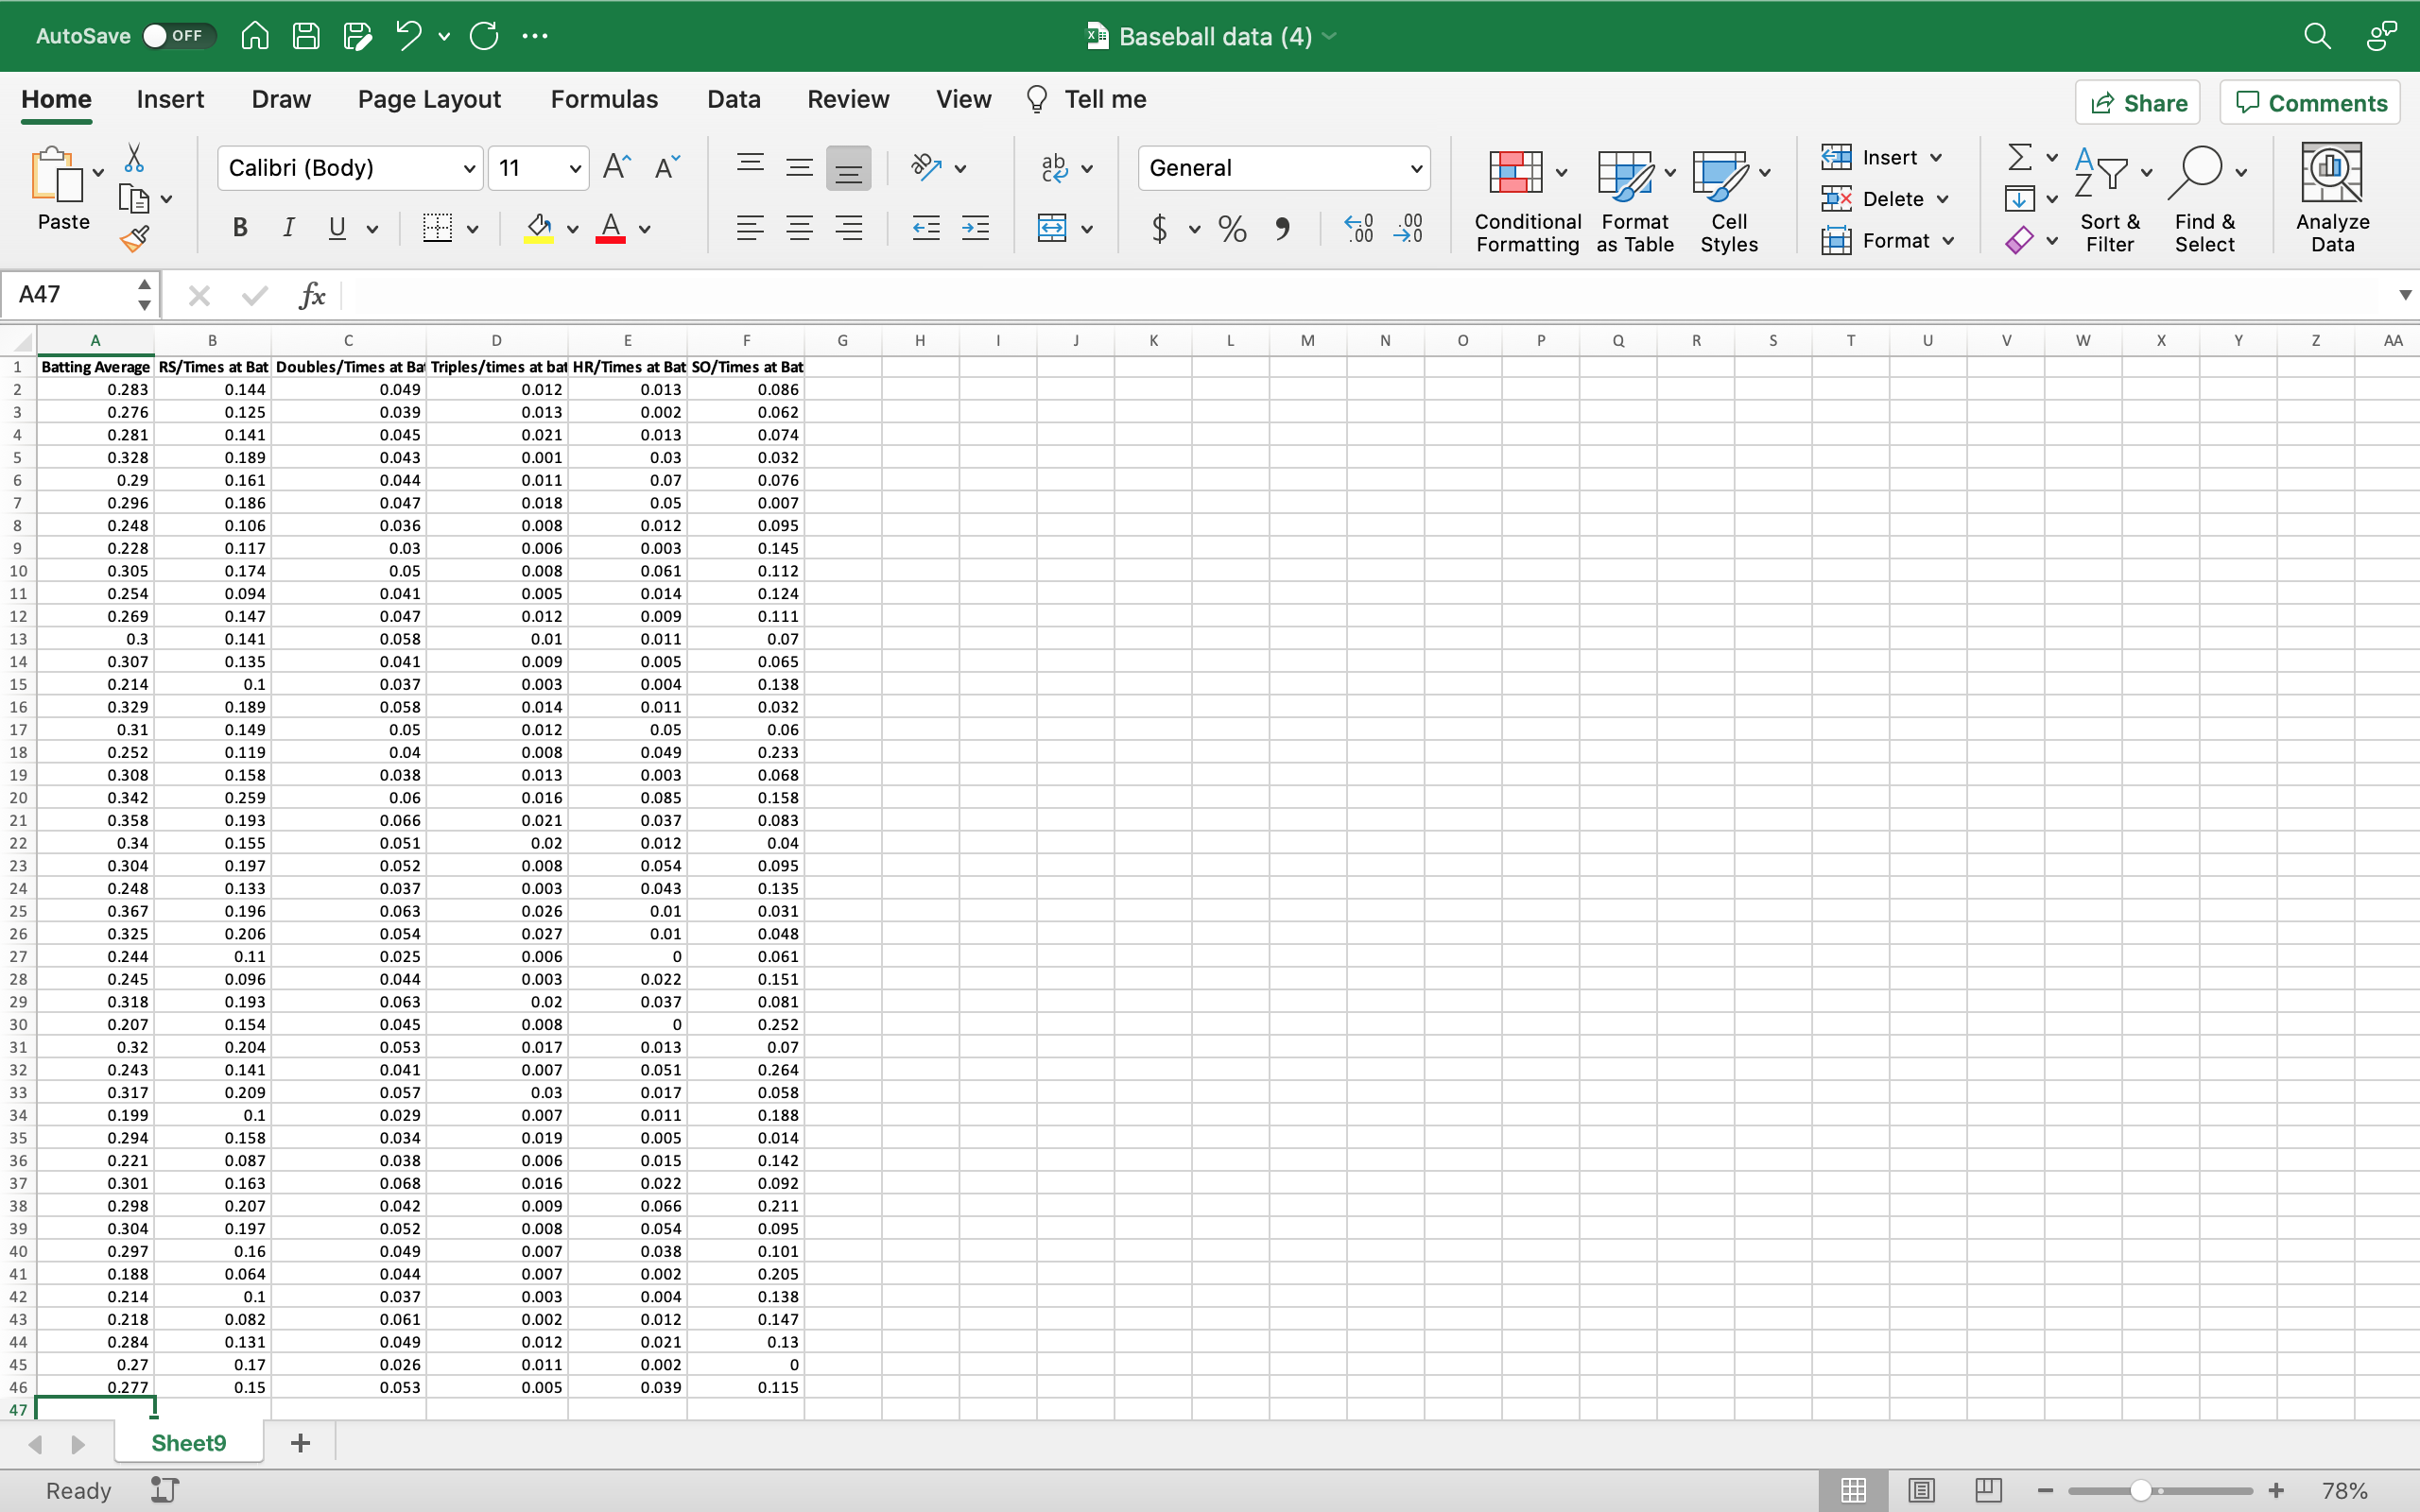
You collect data to, to help estimate Batting Average, to see which players you should choose. You collect data on 45 players to help make your decision.
x1 = Runs Score/Times at Bat
x2 = Doubles/Times at Bat
x3 = Triples/Times at Bat
x4 = Home Runs/Times at Bat
x5= Strike Outs/Times at Bat
Find the estimated regression equation which can be used to estimate Batting Averages when using these 5 variables are predictor variables.
See Attached Excel for Data.
Step by Step Solution
There are 3 Steps involved in it
Step: 1

Get Instant Access to Expert-Tailored Solutions
See step-by-step solutions with expert insights and AI powered tools for academic success
Step: 2

Step: 3
Ace Your Homework with AI
Get the answers you need in no time with our AI-driven, step-by-step assistance
Get Started
Calculus I With Integrated Precalculus
Authors: Laura Taalman
1st Edition
1464153027, 9781464153020