You do not have to do any calculations for this question. You only need to explain, in a few sentences, what each example means; hence, your answers are strictly qualitative. However, you should be familiar with the calculations.
Examples 1, 2, 7 and 8 in Ch. 12 and example 1 in Ch. 13.
For examples 1 and 2 in Ch. 12, assume the net cash flow is $2,000,000, the tax rate is 40% and the cost of common equity is 10% which is computed using the CAPM equation.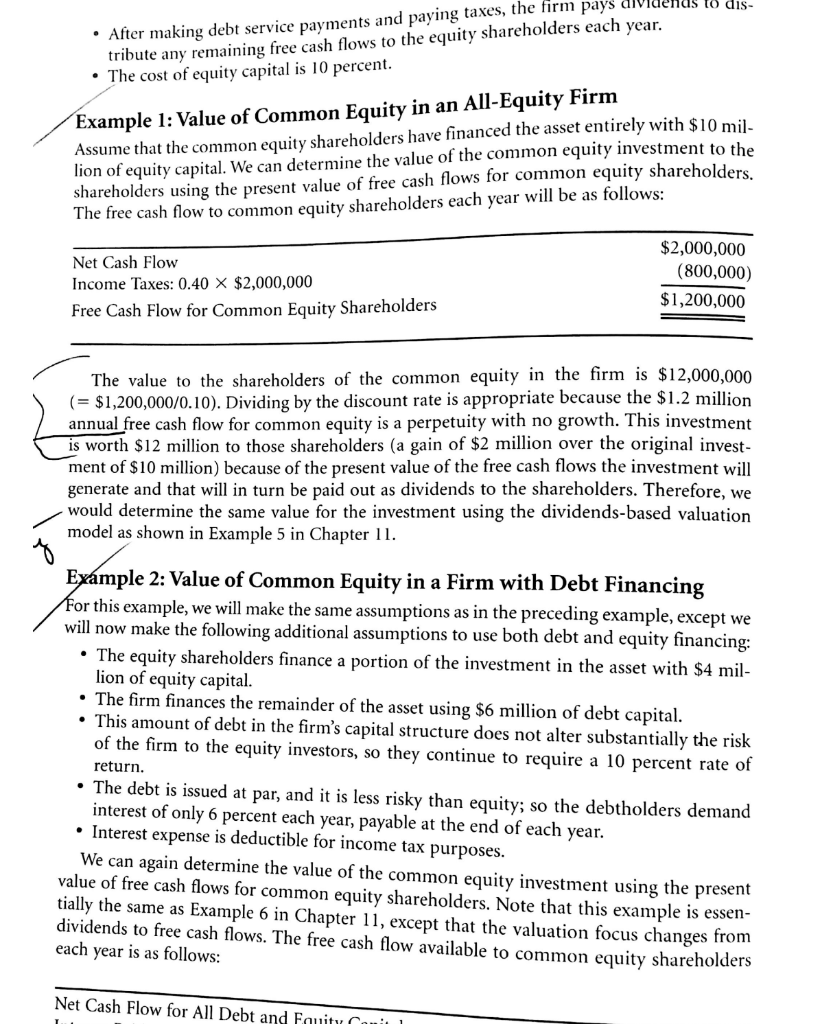
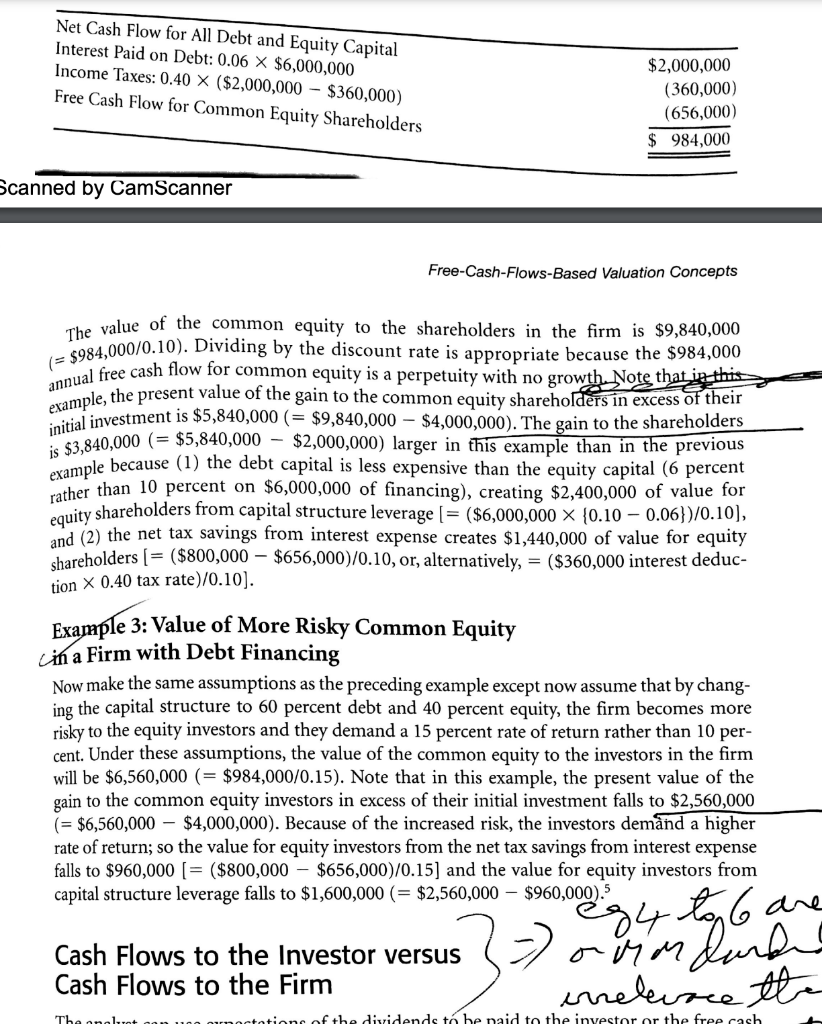
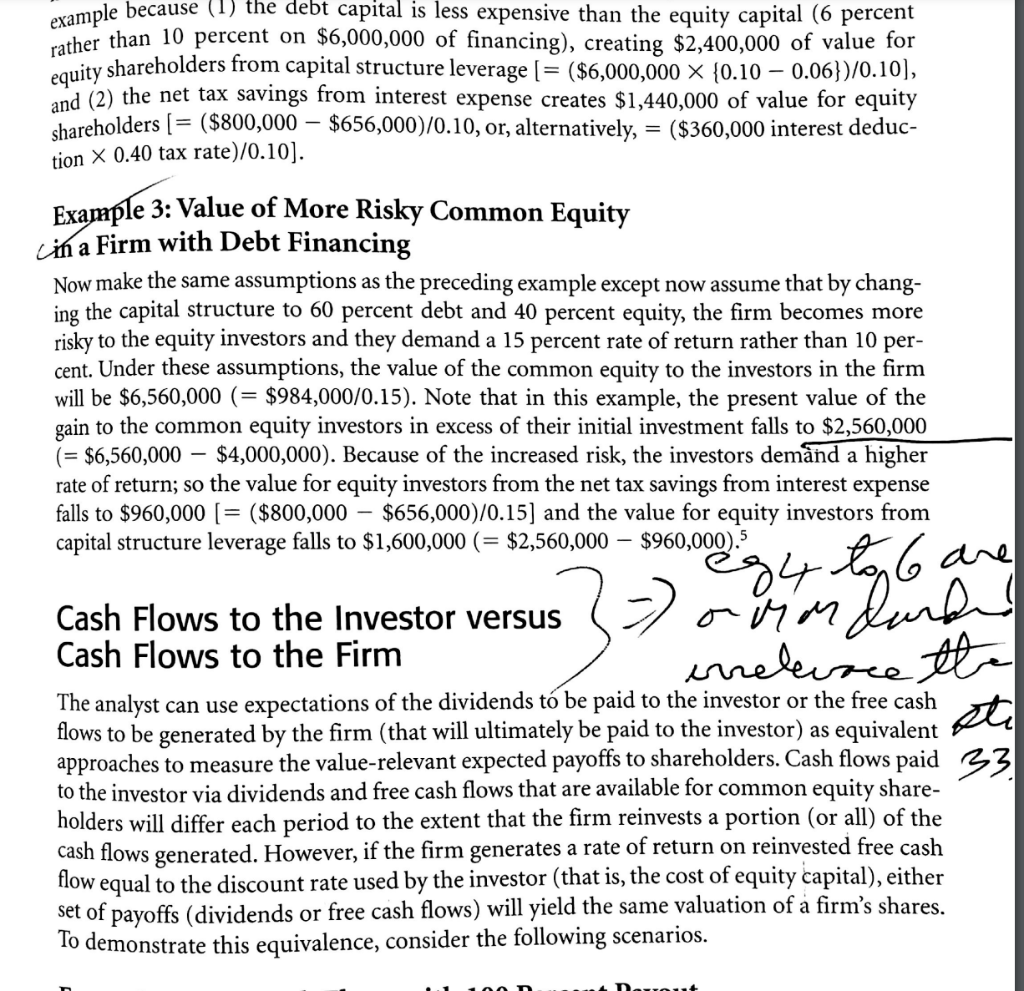
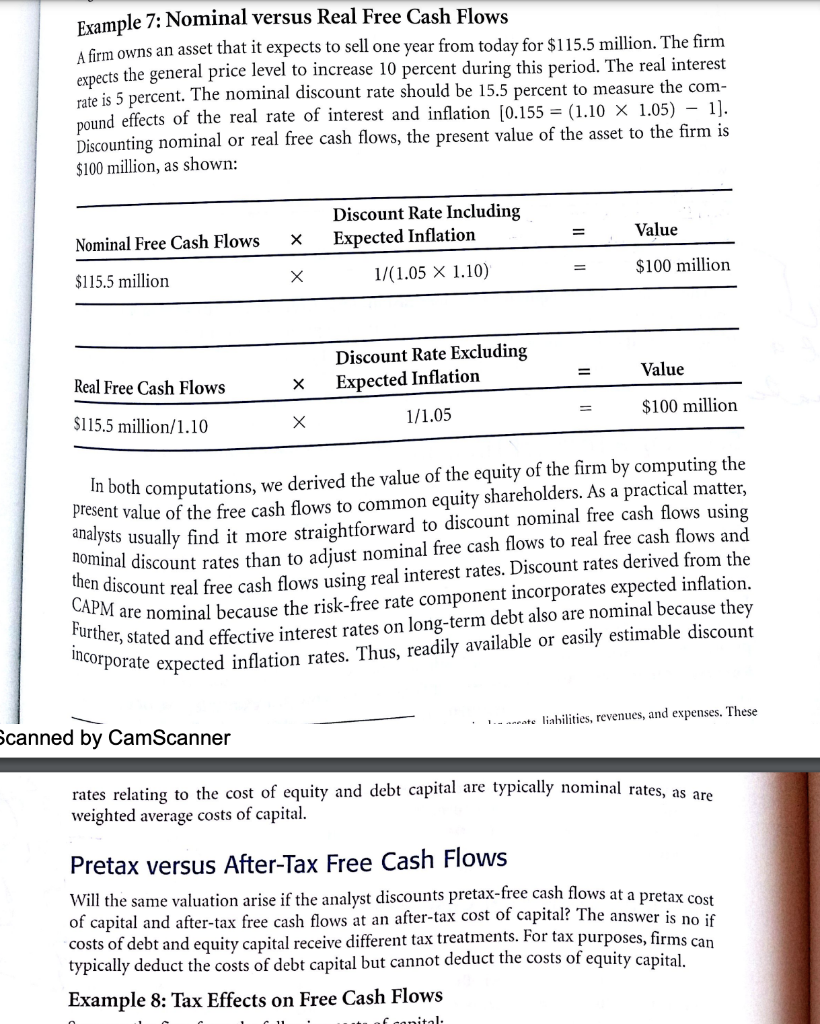
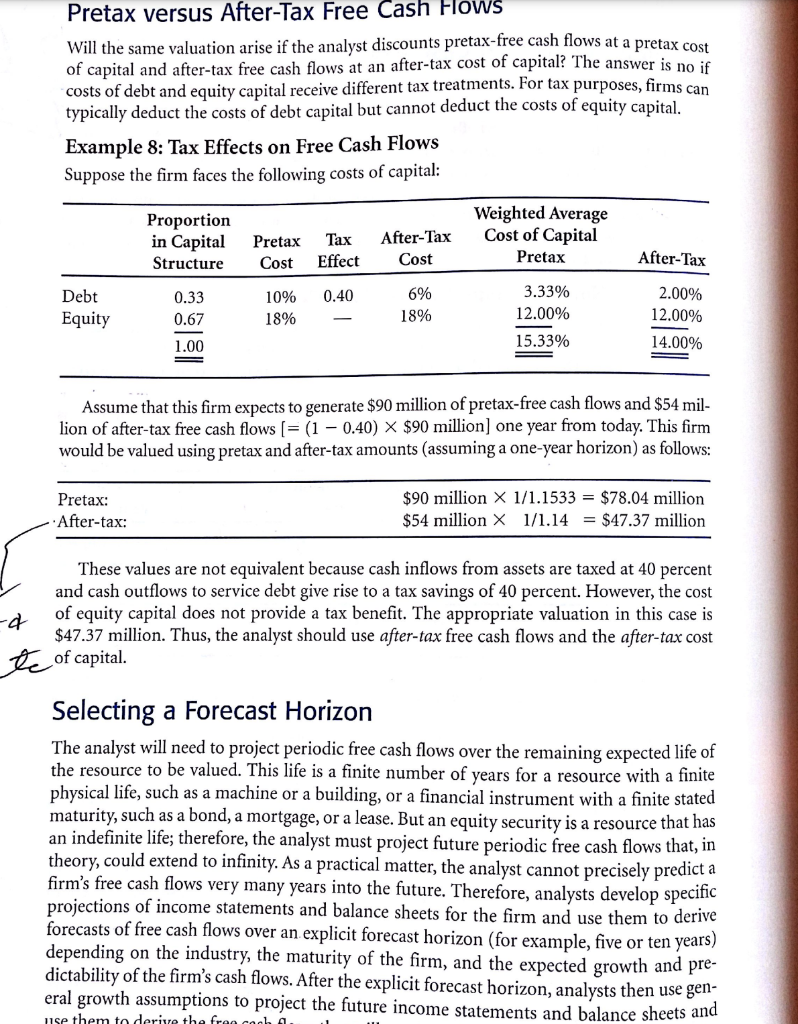
After making debt service payments and paying taxes, the firm pays dividends to dis- tribute any remaining free cash flows to the equity shareholders each year. The cost of equity capital is 10 percent. Example 1: Value of Common Equity in an All-Equity Firm Assume that the common equity shareholders have financed the asset entirely with $10 mil- lion of equity capital. We can determine the value of the common equity investment to the shareholders using the present value of free cash flows for common equity shareholders. The free cash flow to common equity shareholders each year will be as follows: Net Cash Flow Income Taxes: 0.40 X $2,000,000 Free Cash Flow for Common Equity Shareholders $2,000,000 (800,000) $1,200,000 The value to the shareholders of the common equity in the firm is $12,000,000 (= $1,200,000/0.10). Dividing by the discount rate is appropriate because the $1.2 million annual free cash flow for common equity is a perpetuity with no growth. This investment is worth $12 million to those shareholders (a gain of $2 million over the original invest- ment of $10 million) because of the present value of the free cash flows the investment will generate and that will in turn be paid out as dividends to the shareholders. Therefore, we would determine the same value for the investment using the dividends-based valuation model as shown in Example 5 in Chapter 11. g Example 2: Value of Common Equity in a Firm with Debt Financing For this example, we will make the same assumptions as in the preceding example, except we will now make the following additional assumptions to use both debt and equity financing: The equity shareholders finance a portion of the investment in the asset with $4 mil- lion of equity capital. The firm finances the remainder of the asset using $6 million of debt capital. This amount of debt in the firm's capital structure does not alter substantially the risk of the firm to the equity investors, so they continue to require a 10 percent rate of return. The debt is issued at par, and it is less risky than equity; so the debtholders demand interest of only 6 percent each year, payable at the end of each year. Interest expense is deductible for income tax purposes. We can again determine the value of the common equity investment using the present value of free cash flows for common equity shareholders. Note that this example is essen- tially the same as Example 6 in Chapter 11, except that the valuation focus changes from dividends to free cash flows. The free cash flow available to common equity shareholders each year is as follows: Net Cash Flow for All Debt and Fauity Comit Net Cash Flow for All Debt and Equity Capital Interest Paid on Debt: 0.06 X $6,000,000 Income Taxes: 0.40 X ($2,000,000 - $360,000) Free Cash Flow for Common Equity Shareholders $2,000,000 (360,000) (656,000) 984,000 Scanned by CamScanner Free-Cash-Flows-Based Valuation Concepts The value of the common equity to the shareholders in the firm is $9,840,000 (= $984,000/0,10). Dividing by the discount rate is appropriate because the $984,000 annual free cash flow for common equity is a perpetuity with no growth. Note that in this example , the present value of the gain to the common equity shareholders in excess of their initial investment is $5,840,000 (= $9,840,000 $4,000,000). The gain to the shareholders is $3,840,000 (= $5,840,000 - $2,000,000) larger in this example than in the previous example because (1) the debt capital is less expensive than the equity capital (6 percent rather than 10 percent on $6,000,000 of financing), creating $2,400,000 of value for equity shareholders from capital structure leverage (= ($6,000,000 > {0.10 0.06})/0.101, and (2) the net tax savings from interest expense creates $1,440,000 of value for equity shareholders (= ($800,000 $656,000)/0.10, or, alternatively, = ($360,000 interest deduc- tion X 0.40 tax rate)/0.10). Example 3: Value of More Risky Common Equity cih a Firm with Debt Financing Now make the same assumptions as the preceding example except now assume that by chang- ing the capital structure to 60 percent debt and 40 percent equity, the firm becomes more risky to the equity investors and they demand a 15 percent rate of return rather than 10 per- cent. Under these assumptions, the value of the common equity to the investors in the firm will be $6,560,000 (= $984,000/0.15). Note that in this example, the present value of the gain to the common equity investors in excess of their initial investment falls to $2,560,000 (= $6,560,000 $4,000,000). Because of the increased risk, the investors demand a higher rate of return; so the value for equity investors from the net tax savings from interest expense falls to $960,000 (= ($800,000 $656,000)/0.15) and the value for equity investors from capital structure leverage falls to $1,600,000 (= $2,560,000 $960,000). are Cash Flows to the Investor versus o mordard Cash Flows to the Firm irrelwoce the 3}? sy to 6 The anal tione of the dividends to be paid to the investor or the free cash example because (1) the debt capital is less expensive than the equity capital (6 percent rather than 10 percent on $6,000,000 of financing), creating $2,400,000 of value for equity shareholders from capital structure leverage ( = ($6,000,000 > {0.10 0.06})/0.10), and (2) the net tax savings from interest expense creates $1,440,000 of value for equity shareholders (= ($800,000 $656,000)/0.10, or, alternatively, = ($360,000 interest deduc- tion X 0.40 tax rate)/0.10). Example 3: Value of More Risky Common Equity ciha Firm with Debt Financing Now make the same assumptions as the preceding example except now assume that by chang- ing the capital structure to 60 percent debt and 40 percent equity, the firm becomes more risky to the equity investors and they demand a 15 percent rate of return rather than 10 per- cent. Under these assumptions, the value of the common equity to the investors in the firm will be $6,560,000 (= $984,000/0.15). Note that in this example, the present value of the gain to the common equity investors in excess of their initial investment falls to $2,560,000 (= $6,560,000 $4,000,000). Because of the increased risk, the investors demand a higher rate of return; so the value for equity investors from the net tax savings from interest expense falls to $960,000 (= ($800,000 $656,000)/0.15) and the value for equity investors from capital structure leverage falls to $1,600,000 (= $2,560,000 $960,000).5 eg4 to 6 are a rondaran 1 errelwoce the ste Cash Flows to the Investor versus Cash Flows to the Firm The analyst can use expectations of the dividends to be paid to the investor or the free cash flows to be generated by the firm (that will ultimately be paid to the investor) as equivalent approaches to measure the value-relevant expected payoffs to shareholders. Cash flows paid 33. to the investor via dividends and free cash flows that are available for common equity share- holders will differ each period to the extent that the firm reinvests a portion (or all) of the cash flows generated. However, if the firm generates a rate of return on reinvested free cash flow equal to the discount rate used by the investor (that is, the cost fequity capital), either set of payoffs (dividends or free cash flows) will yield the same valuation of a firm's shares. To demonstrate this equivalence, consider the following scenarios. Nonnut Example 7: Nominal versus Real Free Cash Flows A firm owns an asset that it expects to sell one year from today for $115.5 million. The firm expects the general price level to increase 10 percent during this period. The real interest rate is 5 percent. The nominal discount rate should be 15.5 percent to measure the com- pound effects of the real rate of interest and inflation (0.155 = (1.10 x 1.05) 1). Discounting nominal or real free cash flows, the present value of the asset to the firm is $100 million, as shown: = Value Nominal Free Cash Flows Discount Rate Including Expected Inflation 1/(1.05 X 1.10) = $100 million $115.5 million Discount Rate Excluding Expected Inflation Value = Real Free Cash Flows = $100 million 1/1.05 $115.5 million/1.10 In both computations, we derived the value of the equity of the firm by computing the present value of the free cash flows to common equity shareholders. As a practical matter, analysts usually find it more straightforward to discount nominal free cash flows using nominal discount rates than to adjust nominal free cash flows to real free cash flows and then discount real free cash flows using real interest rates. Discount rates derived from the CAPM are nominal because the risk-free rate component incorporates expected inflation. Further, stated and effective interest rates on long-term debt also are nominal because they incorporate expected inflation rates. Thus, readily available or easily estimable discount 1.- aneste liabilities, revenues, and expenses. These Scanned by CamScanner rates relating to the cost of equity and debt capital are typically nominal rates, as are weighted average costs of capital. Pretax versus After-Tax Free Cash Flows Will the same valuation arise if the analyst discounts pretax-free cash flows at a pretax cost of capital and after-tax free cash flows at an after-tax cost of capital? The answer is no if costs of debt and equity capital receive different tax treatments. For tax purposes, firms can typically deduct the costs of debt capital but cannot deduct the costs of equity capital. Example 8: Tax Effects on Free Cash Flows f canital: Pretax versus After-Tax Free Cash Flows Will the same valuation arise if the analyst discounts pretax-free cash flows at a pretax cost of capital and after-tax free cash flows at an after-tax cost of capital? The answer is no if costs of debt and equity capital receive different tax treatments. For tax purposes, firms can typically deduct the costs of debt capital but cannot deduct the costs of equity capital. Example 8: Tax Effects on Free Cash Flows Suppose the firm faces the following costs of capital: Proportion in Capital Structure Pretax Cost Tax Effect After-Tax Cost Weighted Average Cost of Capital Pretax After-Tax 10% 0.40 Debt Equity 0.33 0.67 6% 18% 18% 3.33% 12.00% 15.33% 2.00% 12.00% 14.00% 1.00 Assume that this firm expects to generate $90 million of pretax-free cash flows and $54 mil- lion of after-tax free cash flows (= (1 - 0.40) {0.10 0.06})/0.101, and (2) the net tax savings from interest expense creates $1,440,000 of value for equity shareholders (= ($800,000 $656,000)/0.10, or, alternatively, = ($360,000 interest deduc- tion X 0.40 tax rate)/0.10). Example 3: Value of More Risky Common Equity cih a Firm with Debt Financing Now make the same assumptions as the preceding example except now assume that by chang- ing the capital structure to 60 percent debt and 40 percent equity, the firm becomes more risky to the equity investors and they demand a 15 percent rate of return rather than 10 per- cent. Under these assumptions, the value of the common equity to the investors in the firm will be $6,560,000 (= $984,000/0.15). Note that in this example, the present value of the gain to the common equity investors in excess of their initial investment falls to $2,560,000 (= $6,560,000 $4,000,000). Because of the increased risk, the investors demand a higher rate of return; so the value for equity investors from the net tax savings from interest expense falls to $960,000 (= ($800,000 $656,000)/0.15) and the value for equity investors from capital structure leverage falls to $1,600,000 (= $2,560,000 $960,000). are Cash Flows to the Investor versus o mordard Cash Flows to the Firm irrelwoce the 3}? sy to 6 The anal tione of the dividends to be paid to the investor or the free cash example because (1) the debt capital is less expensive than the equity capital (6 percent rather than 10 percent on $6,000,000 of financing), creating $2,400,000 of value for equity shareholders from capital structure leverage ( = ($6,000,000 > {0.10 0.06})/0.10), and (2) the net tax savings from interest expense creates $1,440,000 of value for equity shareholders (= ($800,000 $656,000)/0.10, or, alternatively, = ($360,000 interest deduc- tion X 0.40 tax rate)/0.10). Example 3: Value of More Risky Common Equity ciha Firm with Debt Financing Now make the same assumptions as the preceding example except now assume that by chang- ing the capital structure to 60 percent debt and 40 percent equity, the firm becomes more risky to the equity investors and they demand a 15 percent rate of return rather than 10 per- cent. Under these assumptions, the value of the common equity to the investors in the firm will be $6,560,000 (= $984,000/0.15). Note that in this example, the present value of the gain to the common equity investors in excess of their initial investment falls to $2,560,000 (= $6,560,000 $4,000,000). Because of the increased risk, the investors demand a higher rate of return; so the value for equity investors from the net tax savings from interest expense falls to $960,000 (= ($800,000 $656,000)/0.15) and the value for equity investors from capital structure leverage falls to $1,600,000 (= $2,560,000 $960,000).5 eg4 to 6 are a rondaran 1 errelwoce the ste Cash Flows to the Investor versus Cash Flows to the Firm The analyst can use expectations of the dividends to be paid to the investor or the free cash flows to be generated by the firm (that will ultimately be paid to the investor) as equivalent approaches to measure the value-relevant expected payoffs to shareholders. Cash flows paid 33. to the investor via dividends and free cash flows that are available for common equity share- holders will differ each period to the extent that the firm reinvests a portion (or all) of the cash flows generated. However, if the firm generates a rate of return on reinvested free cash flow equal to the discount rate used by the investor (that is, the cost fequity capital), either set of payoffs (dividends or free cash flows) will yield the same valuation of a firm's shares. To demonstrate this equivalence, consider the following scenarios. Nonnut Example 7: Nominal versus Real Free Cash Flows A firm owns an asset that it expects to sell one year from today for $115.5 million. The firm expects the general price level to increase 10 percent during this period. The real interest rate is 5 percent. The nominal discount rate should be 15.5 percent to measure the com- pound effects of the real rate of interest and inflation (0.155 = (1.10 x 1.05) 1). Discounting nominal or real free cash flows, the present value of the asset to the firm is $100 million, as shown: = Value Nominal Free Cash Flows Discount Rate Including Expected Inflation 1/(1.05 X 1.10) = $100 million $115.5 million Discount Rate Excluding Expected Inflation Value = Real Free Cash Flows = $100 million 1/1.05 $115.5 million/1.10 In both computations, we derived the value of the equity of the firm by computing the present value of the free cash flows to common equity shareholders. As a practical matter, analysts usually find it more straightforward to discount nominal free cash flows using nominal discount rates than to adjust nominal free cash flows to real free cash flows and then discount real free cash flows using real interest rates. Discount rates derived from the CAPM are nominal because the risk-free rate component incorporates expected inflation. Further, stated and effective interest rates on long-term debt also are nominal because they incorporate expected inflation rates. Thus, readily available or easily estimable discount 1.- aneste liabilities, revenues, and expenses. These Scanned by CamScanner rates relating to the cost of equity and debt capital are typically nominal rates, as are weighted average costs of capital. Pretax versus After-Tax Free Cash Flows Will the same valuation arise if the analyst discounts pretax-free cash flows at a pretax cost of capital and after-tax free cash flows at an after-tax cost of capital? The answer is no if costs of debt and equity capital receive different tax treatments. For tax purposes, firms can typically deduct the costs of debt capital but cannot deduct the costs of equity capital. Example 8: Tax Effects on Free Cash Flows f canital: Pretax versus After-Tax Free Cash Flows Will the same valuation arise if the analyst discounts pretax-free cash flows at a pretax cost of capital and after-tax free cash flows at an after-tax cost of capital? The answer is no if costs of debt and equity capital receive different tax treatments. For tax purposes, firms can typically deduct the costs of debt capital but cannot deduct the costs of equity capital. Example 8: Tax Effects on Free Cash Flows Suppose the firm faces the following costs of capital: Proportion in Capital Structure Pretax Cost Tax Effect After-Tax Cost Weighted Average Cost of Capital Pretax After-Tax 10% 0.40 Debt Equity 0.33 0.67 6% 18% 18% 3.33% 12.00% 15.33% 2.00% 12.00% 14.00% 1.00 Assume that this firm expects to generate $90 million of pretax-free cash flows and $54 mil- lion of after-tax free cash flows (= (1 - 0.40)