Answered step by step
Verified Expert Solution
Question
1 Approved Answer
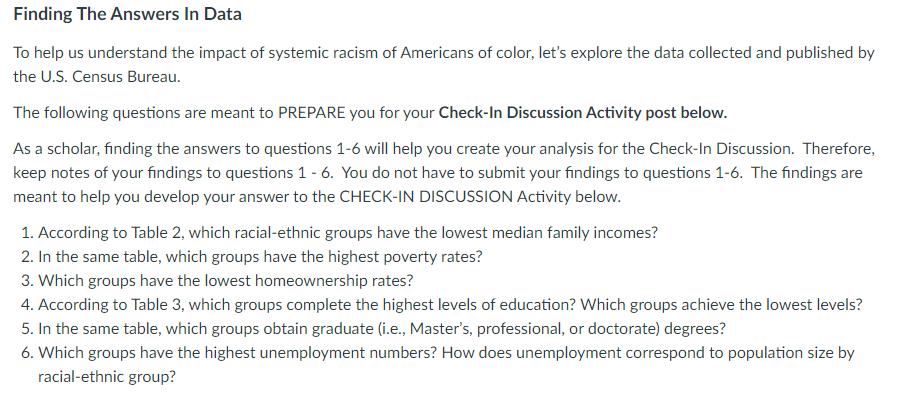
( you do not need to submit the answers to 1-6) Number your answers for questions 1 & 2. After exploring and developing your finings


- ( you do not need to submit the answers to 1-6) Number your answers for questions 1 & 2.
- After exploring and developing your finings to question 1-6 (above), what racial-ethnic group patterns do you find? Tell us your conclusion based on the data. Tell the story behind the numbers. This is hard. Yet try using the data to create your conclusions. This is called data-driven logic.
- Connect, relate or correlate a data set to anything from Unit 1 - meaning, out of all the data you just engaged in, how is it relevant to the ANY part of the unit? Be specific when you identify the connection/correlation. (You might not think there is a connection, BUT you should return back into the unit to create a connection. In other words, how can this data provide evidence to a source from unit 1?)
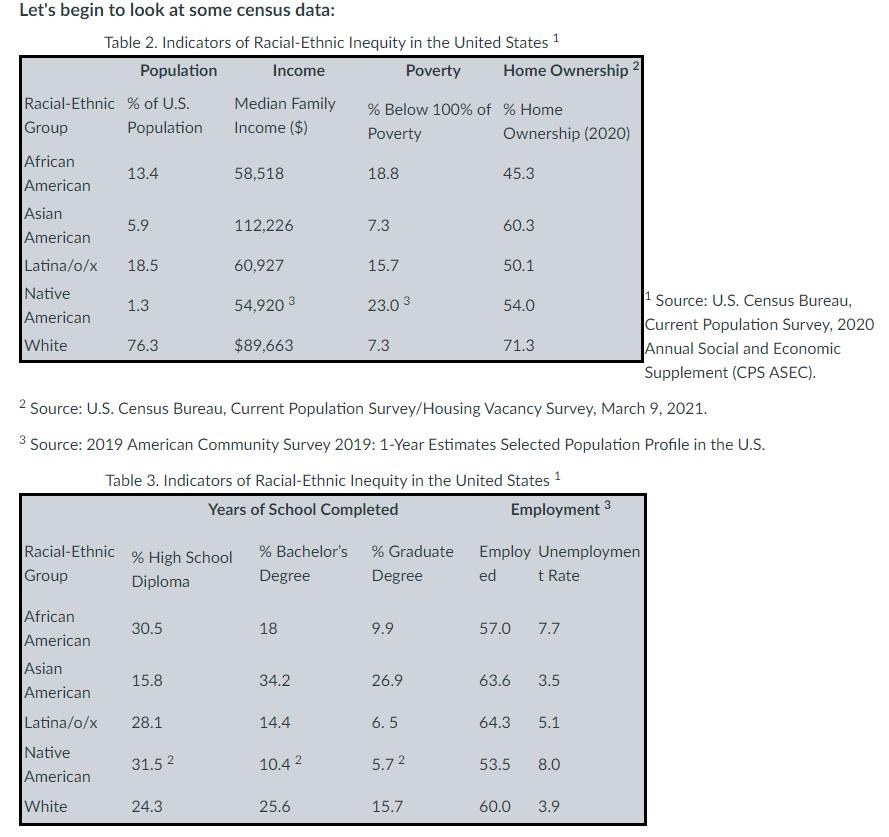
Let's begin to look at some census data: Table 2. Indicators of Racial-Ethnic Inequity in the United States 1 Population Income Poverty Home Ownership Racial-Ethnic % of U.S. Median Family % Below 100% of % Home Group Population Income ($) Poverty Ownership (2020) African 13.4 58,518 18.8 45.3 American Asian 5.9 112,226 7.3 60.3 American Latina/o/x 18.5 60,927 15.7 50.1 Native 1.3 54,920 3 23.03 54.0 1 Source: U.S. Census Bureau, American Current Population Survey, 2020 White 76.3 $89,663 7.3 71.3 Annual Social and Economic Supplement (CPS ASEC). 2 Source: U.S. Census Bureau, Current Population Survey/Housing Vacancy Survey, March 9, 2021. 3 Source: 2019 American Community Survey 2019: 1-Year Estimates Selected Population Profile in the U.S. Table 3. Indicators of Racial-Ethnic Inequity in the United States 1 Years of School Completed Employment 3 Racial-Ethnic %High School % Bachelor's % Graduate Employ Unemploymen Group Diploma Degree Degree ed t Rate African 30.5 18 9.9 57.0 7.7 American Asian 15.8 34.2 26.9 63.6 3.5 American Latina/o/x 28.1 14.4 6.5 64.3 5.1 Native 31.52 10.4 2 5.72 53.5 8.0 American White 24.3 25.6 15.7 60.0 3.9
Step by Step Solution
There are 3 Steps involved in it
Step: 1

Get Instant Access to Expert-Tailored Solutions
See step-by-step solutions with expert insights and AI powered tools for academic success
Step: 2

Step: 3

Ace Your Homework with AI
Get the answers you need in no time with our AI-driven, step-by-step assistance
Get Started


