

Answered step by step
Verified Expert Solution
Question
1 Approved Answer
You enter into the following option positions with firm ABC Inc, which expire in one year : (i) Buy a call option with an exercise
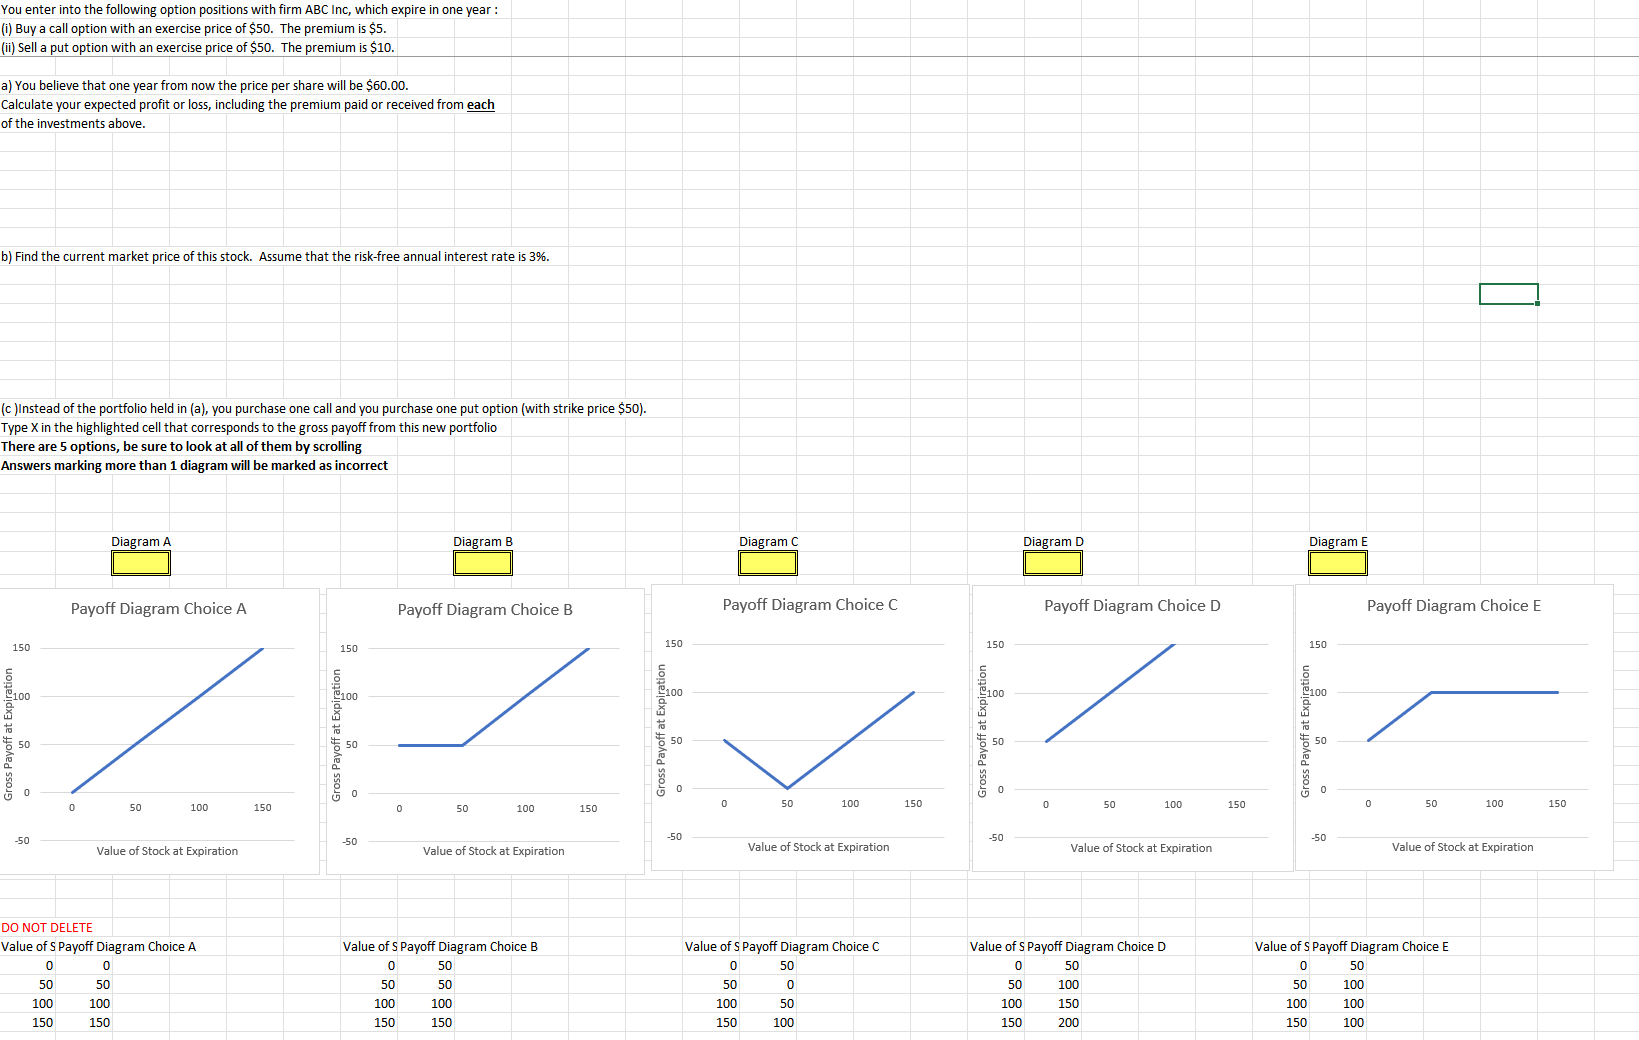 You enter into the following option positions with firm ABC Inc, which expire in one year : (i) Buy a call option with an exercise price of $50. The premium is $5. (ii) Sell a put option with an exercise price of $50. The premium is $10. a) You believe that one year from now the price per share will be $60.00. Calculate your expected profit or loss, including the premium paid or received from each of the investments above. b) Find the current market price of this stock. Assume that the risk-free annual interest rate is 3%. (c) Instead of the portfolio held in (a), you purchase one call and you purchase one put option (with strike price \$50). Type X in the highlighted cell that corresponds to the gross payoff from this new portfolio There are 5 options, be sure to look at all of them by scrolling Answers marking more than 1 diagram will be marked as incorrect Payoff Diagram Choice A 150 50 0 50 Payoff Diagram Choice B 150 50 Diagram B Diagram C Payoff Diagram Choice C 150 50 0 -50 Value of Stock at Expiration Payoff Diagram Choice D 150 50 Diagram D Diagram E Diagram E Value of Stock at Expiration Value of Stock at Expiration Payoff Diagram Choice E 150 100 50 50 Value of Stock at Expiration DO NOT DELETE Value of S Payoff Diagram Choice A \begin{tabular}{|r|r|r|} \hline 0 & 0 & \\ \hline 50 & 50 & \\ \hline 100 & 100 \\ \hline 150 & 150 & \\ \hline \end{tabular} Value of S Payoff Diagram Choice B \begin{tabular}{|r|r|} \hline 0 & 50 \\ \hline 50 & 50 \\ \hline 100 & 100 \\ \hline 150 & 150 \\ \hline \end{tabular} Value of S Payoff Diagram Choice C \begin{tabular}{|r|r|r|} \hline 0 & 50 \\ \hline 50 & 0 \\ \hline 100 & 50 \\ \hline 150 & 100 & \\ \hline \end{tabular} Value of S Payoff Diagram Choice D \begin{tabular}{|r|r|} \hline 0 & 50 \\ \hline 50 & 100 \\ \hline 100 & 150 \\ \hline 150 & 200 \\ \hline \end{tabular} Value of S Payoff Diagram Choice E \begin{tabular}{|r|r|} \hline 0 & 50 \\ \hline 50 & 100 \\ \hline 100 & 100 \\ \hline 150 & 100 \\ \hline \end{tabular}
 Step by Step Solution
There are 3 Steps involved in it
Step: 1

Get Instant Access to Expert-Tailored Solutions
See step-by-step solutions with expert insights and AI powered tools for academic success
Step: 2

Step: 3
Ace Your Homework with AI
Get the answers you need in no time with our AI-driven, step-by-step assistance
Get Started
Financial Analysts Indispensable Pocket Guide
Authors: Ram Ramesh
1st Edition
0071361561, 978-0071361569