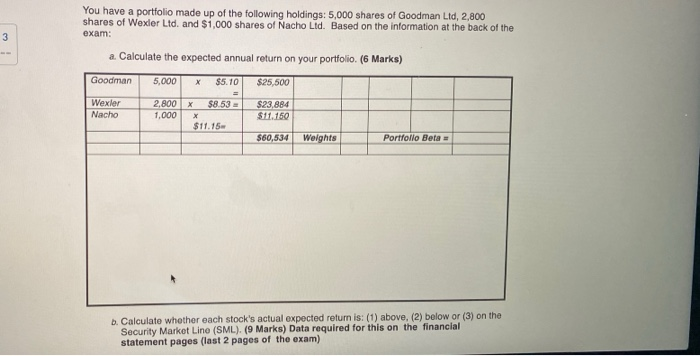
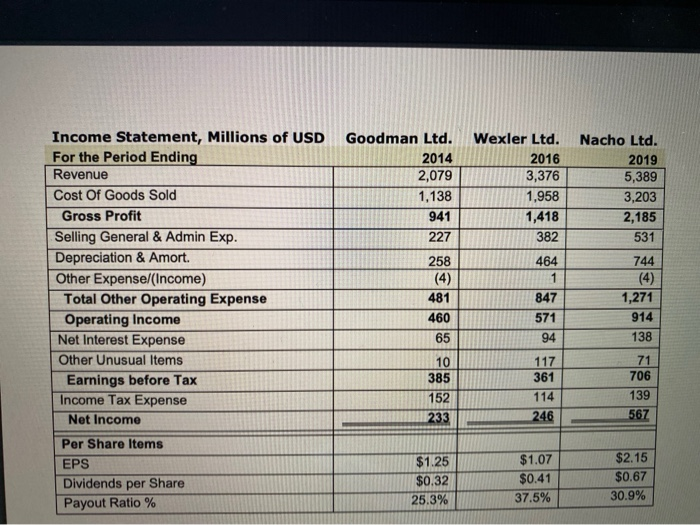
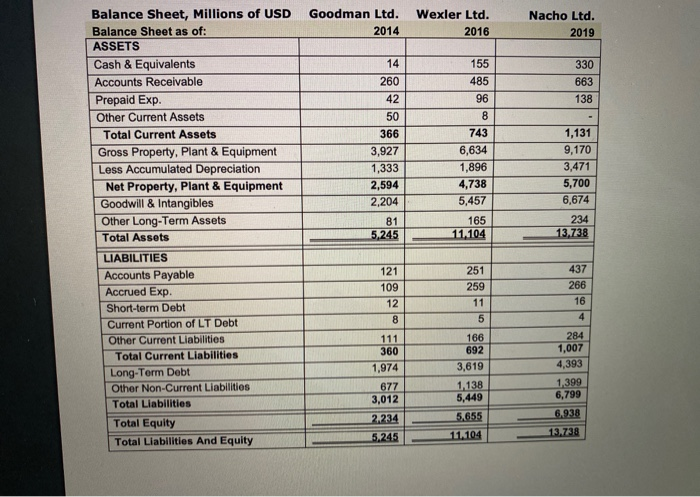
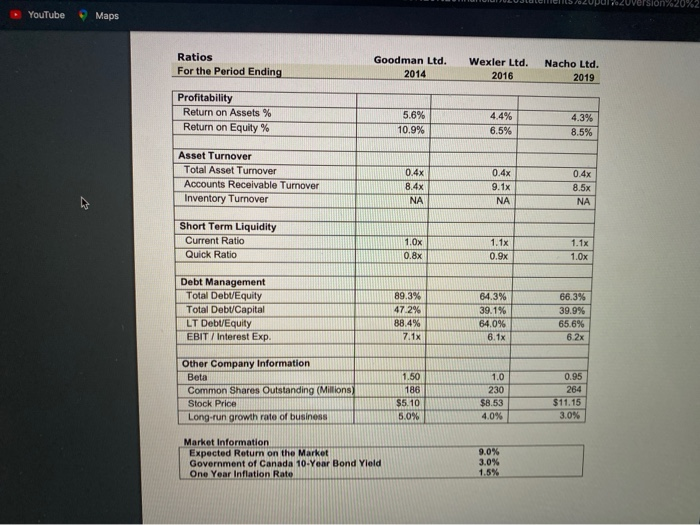
You have a portfolio made up of the following holdings: 5.000 shares of Goodman Lid, 2.800 shares of Wexler Ltd. and $1,000 shares of Nacho Lid. Based on the information at the back of the exam: a. Calculate the expected annual return on your portfolio (6 Marks) Goodman 5,000 X $5.10 $25,500 Wexler Nacho X 2,800 1,000 $8.53 = $23,884 $11.150 $11.15 $60,534 Weights Portfolio Beta b. Calculate whether each stock's actual expected return is: (1) above. (2) below or (3) on the Security Market Line (SML). (9 Marks) Data required for this on the financial statement pages (last 2 pages of the exam) Income Statement, Millions of USD For the Period Ending Revenue Cost Of Goods Sold Gross Profit Selling General & Admin Exp. Depreciation & Amort. Other Expense/Income) Total Other Operating Expense Operating Income Net Interest Expense Other Unusual Items Earnings before Tax Income Tax Expense Net Income Per Share Items EPS Dividends per Share Payout Ratio % Goodman Ltd. Wexler Ltd. Nacho Ltd. 2014 2016 2019 2,079 3,376 5,389 1,138 1,958 3,203 941 1,418 2,185 227 382 531 258 464 744 (4) (4) 481 847 1,271 460 571 914 94 138 65 10 71 705 385 152 117 361 114 246 139 567 233 $1.25 $0.32 25.3% $1.07 $0.41 37.5% $2.15 $0.67 30.9% Goodman Ltd. Wexler Ltd. 2014 2016 Nacho Ltd. 2019 330 663 138 Balance Sheet, Millions of USD Balance Sheet as of: ASSETS Cash & Equivalents Accounts Receivable Prepaid Exp. Other Current Assets Total Current Assets Gross Property, Plant & Equipment Less Accumulated Depreciation Net Property, Plant & Equipment Goodwill & Intangibles Other Long-Term Assets Total Assets LIABILITIES Accounts Payable Accrued Exp. Short-term Debt Current Portion of LT Debt Other Current Liabilities Total Current Liabilities Long-Term Debt Other Non-Current Liabilities Total Liabilities Total Equity Total Liabilities And Equity 14 260 42 50 366 3,927 1,333 2,594 2,204 81 5,245 155 485 96 8 743 6,634 1,896 4,738 5,457 165 11.104 1,131 9,170 3,471 5,700 6,674 234 13,738 251 437 266 259 11 5 360 1,974 677 3,012 2.234 5,245 166 692 3,619 1,138 5,449 5.655 11.104 284 1,007 4,393 1.399 6,799 6.938 13.738 Julen/2Upul re2Uversion%20%2 YouTube Maps For the Period Ending Goodman Ltd. 2014 Wexler Ltd. 2016 Nacho Ltd. 2019 Profitability Return on Assets % Return on Equity % 5.6% 10.9% 4.4% 6.5% Asset Turnover Total Asset Turnover Accounts Receivable Turnover Inventory Turnover 0.4x 8.4x 0.4x 9.1x NA NA Short Term Liquidity Current Ratio Quick Ratio 1.1% 1.Ox 0.8x Debt Management Total Debt/Equity Total Debt/Capital LT Debt Equity EBIT / Interest Exp. 89.3% 47.296 88.4% 64.3% 39.1% 64.0% 6.1x 66.3% 39.9% 65.6% 62x Other Company Information Beta 1.50 10 0.95 264 Common Shares Outstanding (Millions) Stock Price Long-run growth rate of business 186 55.10 5.0% $8.53 4.0% $11.15 3.0% Market Information Expected Return on the Market Government of Canada 10-Year Bond Yield One Year Inflation Rate 9.0% 3.0% 1.5% You have a portfolio made up of the following holdings: 5.000 shares of Goodman Lid, 2.800 shares of Wexler Ltd. and $1,000 shares of Nacho Lid. Based on the information at the back of the exam: a. Calculate the expected annual return on your portfolio (6 Marks) Goodman 5,000 X $5.10 $25,500 Wexler Nacho X 2,800 1,000 $8.53 = $23,884 $11.150 $11.15 $60,534 Weights Portfolio Beta b. Calculate whether each stock's actual expected return is: (1) above. (2) below or (3) on the Security Market Line (SML). (9 Marks) Data required for this on the financial statement pages (last 2 pages of the exam) Income Statement, Millions of USD For the Period Ending Revenue Cost Of Goods Sold Gross Profit Selling General & Admin Exp. Depreciation & Amort. Other Expense/Income) Total Other Operating Expense Operating Income Net Interest Expense Other Unusual Items Earnings before Tax Income Tax Expense Net Income Per Share Items EPS Dividends per Share Payout Ratio % Goodman Ltd. Wexler Ltd. Nacho Ltd. 2014 2016 2019 2,079 3,376 5,389 1,138 1,958 3,203 941 1,418 2,185 227 382 531 258 464 744 (4) (4) 481 847 1,271 460 571 914 94 138 65 10 71 705 385 152 117 361 114 246 139 567 233 $1.25 $0.32 25.3% $1.07 $0.41 37.5% $2.15 $0.67 30.9% Goodman Ltd. Wexler Ltd. 2014 2016 Nacho Ltd. 2019 330 663 138 Balance Sheet, Millions of USD Balance Sheet as of: ASSETS Cash & Equivalents Accounts Receivable Prepaid Exp. Other Current Assets Total Current Assets Gross Property, Plant & Equipment Less Accumulated Depreciation Net Property, Plant & Equipment Goodwill & Intangibles Other Long-Term Assets Total Assets LIABILITIES Accounts Payable Accrued Exp. Short-term Debt Current Portion of LT Debt Other Current Liabilities Total Current Liabilities Long-Term Debt Other Non-Current Liabilities Total Liabilities Total Equity Total Liabilities And Equity 14 260 42 50 366 3,927 1,333 2,594 2,204 81 5,245 155 485 96 8 743 6,634 1,896 4,738 5,457 165 11.104 1,131 9,170 3,471 5,700 6,674 234 13,738 251 437 266 259 11 5 360 1,974 677 3,012 2.234 5,245 166 692 3,619 1,138 5,449 5.655 11.104 284 1,007 4,393 1.399 6,799 6.938 13.738 Julen/2Upul re2Uversion%20%2 YouTube Maps For the Period Ending Goodman Ltd. 2014 Wexler Ltd. 2016 Nacho Ltd. 2019 Profitability Return on Assets % Return on Equity % 5.6% 10.9% 4.4% 6.5% Asset Turnover Total Asset Turnover Accounts Receivable Turnover Inventory Turnover 0.4x 8.4x 0.4x 9.1x NA NA Short Term Liquidity Current Ratio Quick Ratio 1.1% 1.Ox 0.8x Debt Management Total Debt/Equity Total Debt/Capital LT Debt Equity EBIT / Interest Exp. 89.3% 47.296 88.4% 64.3% 39.1% 64.0% 6.1x 66.3% 39.9% 65.6% 62x Other Company Information Beta 1.50 10 0.95 264 Common Shares Outstanding (Millions) Stock Price Long-run growth rate of business 186 55.10 5.0% $8.53 4.0% $11.15 3.0% Market Information Expected Return on the Market Government of Canada 10-Year Bond Yield One Year Inflation Rate 9.0% 3.0% 1.5%


