Question
You have an interview with the head office of Inditex . You realize that you need to have a better understanding about the company so


You have an interview with the head office of Inditex. You realize that you need to have a better understanding about the company so that you can have several thoughtful questions prepared to ask during the interview. For this case, you will use Inditexs performance information to create several visualizations that will help increase your knowledge of the companys operations. Information about Inditexs performance, US clothing store sales, and the European Unions (EU) consumption of textiles is provided in the data that follow. Monetary amounts are in millions.
What do you learn about Inditex that you can share in the interview?
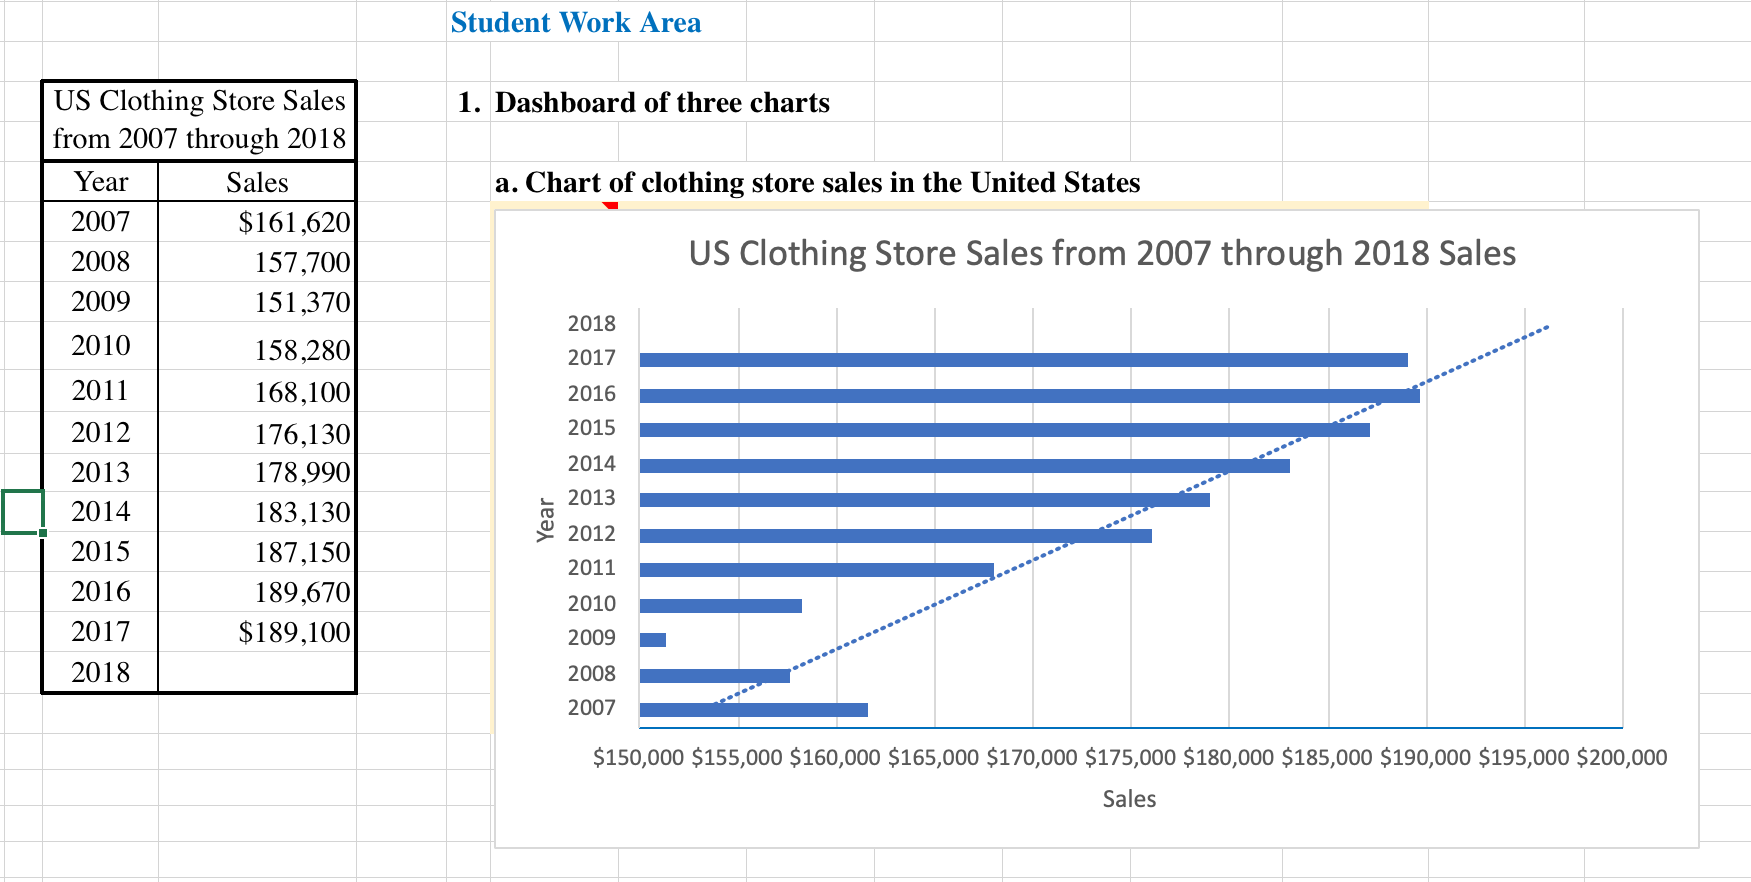
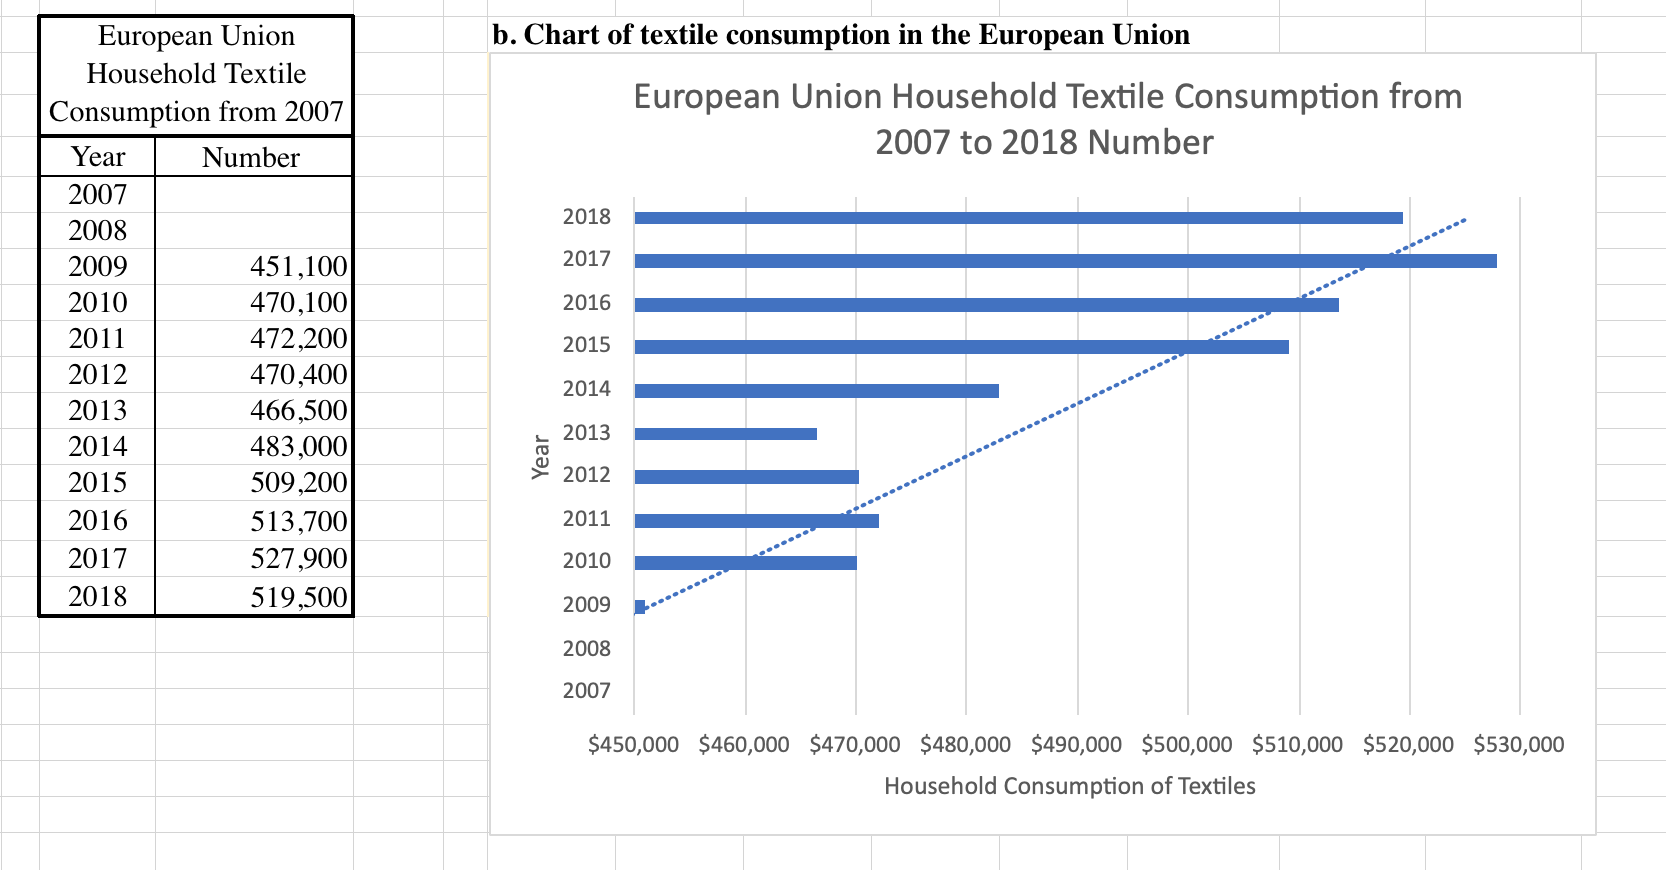
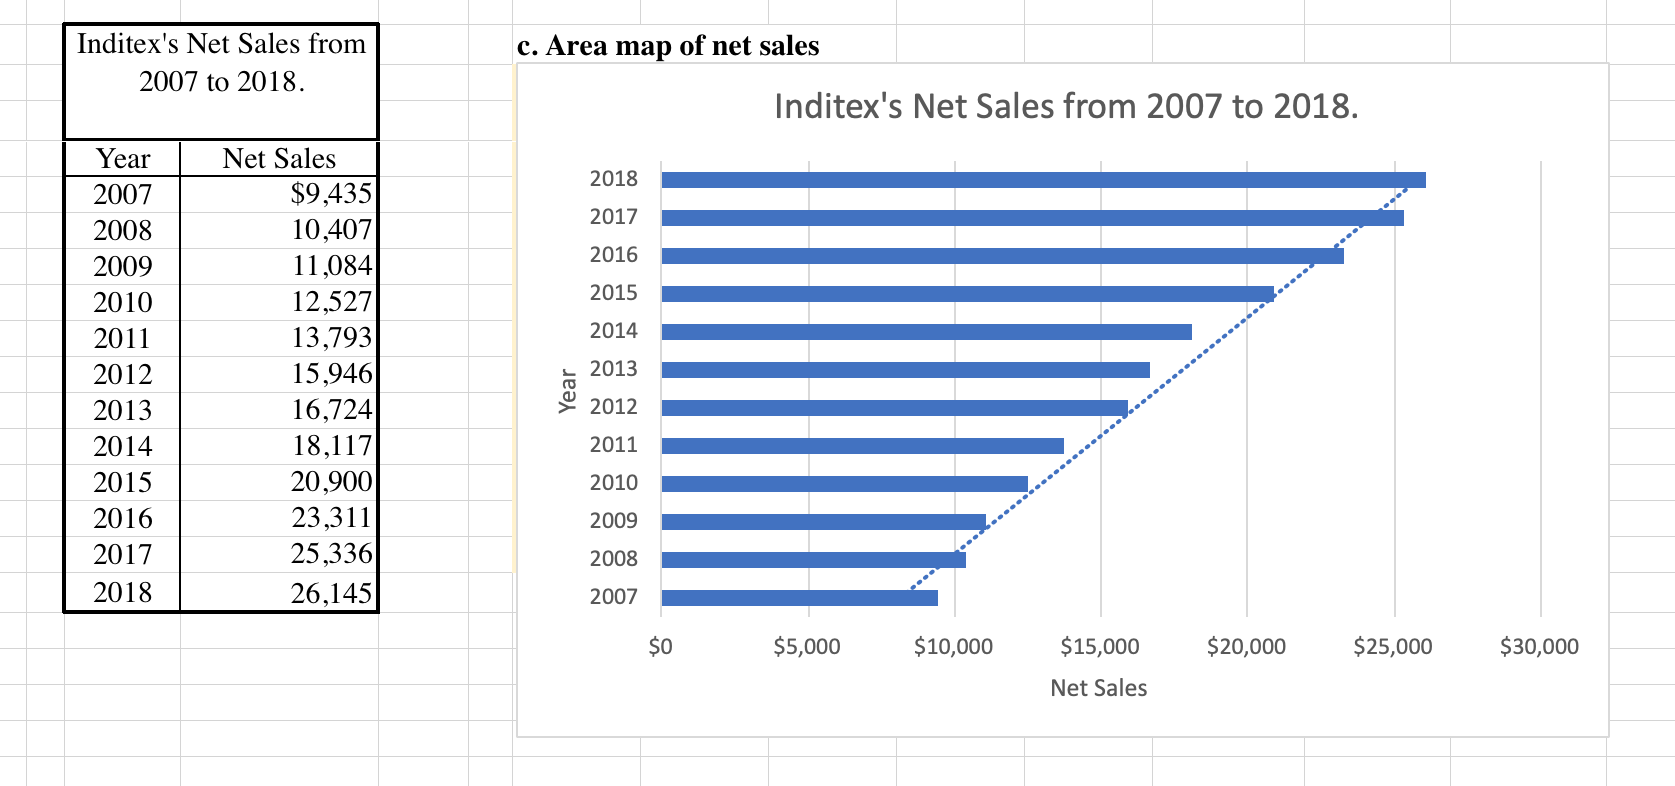
Student Work Area 1. Dashboard of three charts a. Chart of clothing store sales in the United States \begin{tabular}{|c|c|} \hline \multicolumn{2}{|c|}{EuropeanUnionHouseholdTextileConsumptionfrom2007} \\ \hline Year & Number \\ \hline 2007 & \\ 2008 & \\ 2009 & 451,100 \\ 2010 & 470,100 \\ 2011 & 472,200 \\ 2012 & 470,400 \\ 2013 & 466,500 \\ 2014 & 483,000 \\ 2015 & 509,200 \\ 2016 & 513,700 \\ 2017 & 527,900 \\ 2018 & 519,500 \\ \hline \end{tabular} b. Chart of textile consumption in the European Union European Union Household Textile Consumption from 2007 to 2018 Number Household Consumption of Textiles c. Area map of net sales Inditex's Not Salec from 20 no to 2018Step by Step Solution
There are 3 Steps involved in it
Step: 1

Get Instant Access to Expert-Tailored Solutions
See step-by-step solutions with expert insights and AI powered tools for academic success
Step: 2

Step: 3

Ace Your Homework with AI
Get the answers you need in no time with our AI-driven, step-by-step assistance
Get Started


