

Answered step by step
Verified Expert Solution
Question
1 Approved Answer
You have been given the expected return data shown in the first table on three assetslong dashF, G, and H, over the period 2016-2019 Using
You have been given the expected return data shown in the first table on three
assetslong dashF, G, and
H, over the period 2016-2019
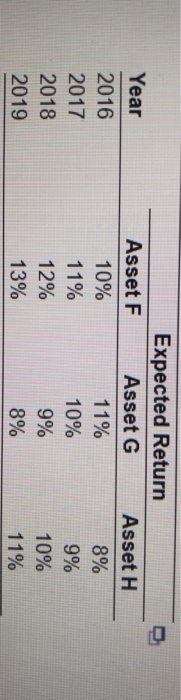
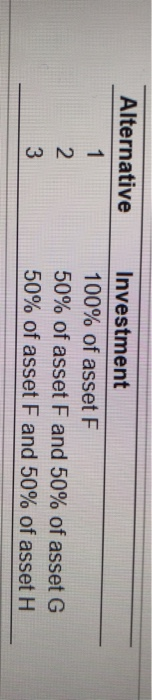
Using these assets, you have isolated the three investment alternatives shown in the following table:
a.Calculate the average return over the 4-year period for each of the three alternatives.
b.Calculate the standard deviation of returns over the 4-year period for each of the three alternatives.
c.Use your findings in parts a and b to calculate the coefficient of variation for each of the three alternatives.
d.On the basis of your findings, which of the three investment alternatives do you think performed better over this period? Why?
Step by Step Solution
There are 3 Steps involved in it
Step: 1

Get Instant Access to Expert-Tailored Solutions
See step-by-step solutions with expert insights and AI powered tools for academic success
Step: 2

Step: 3
Ace Your Homework with AI
Get the answers you need in no time with our AI-driven, step-by-step assistance
Get Started
Principles Of Public Finance
Authors: Toshihiro Ihori
1st Edition
9811023883, 978-9811023880