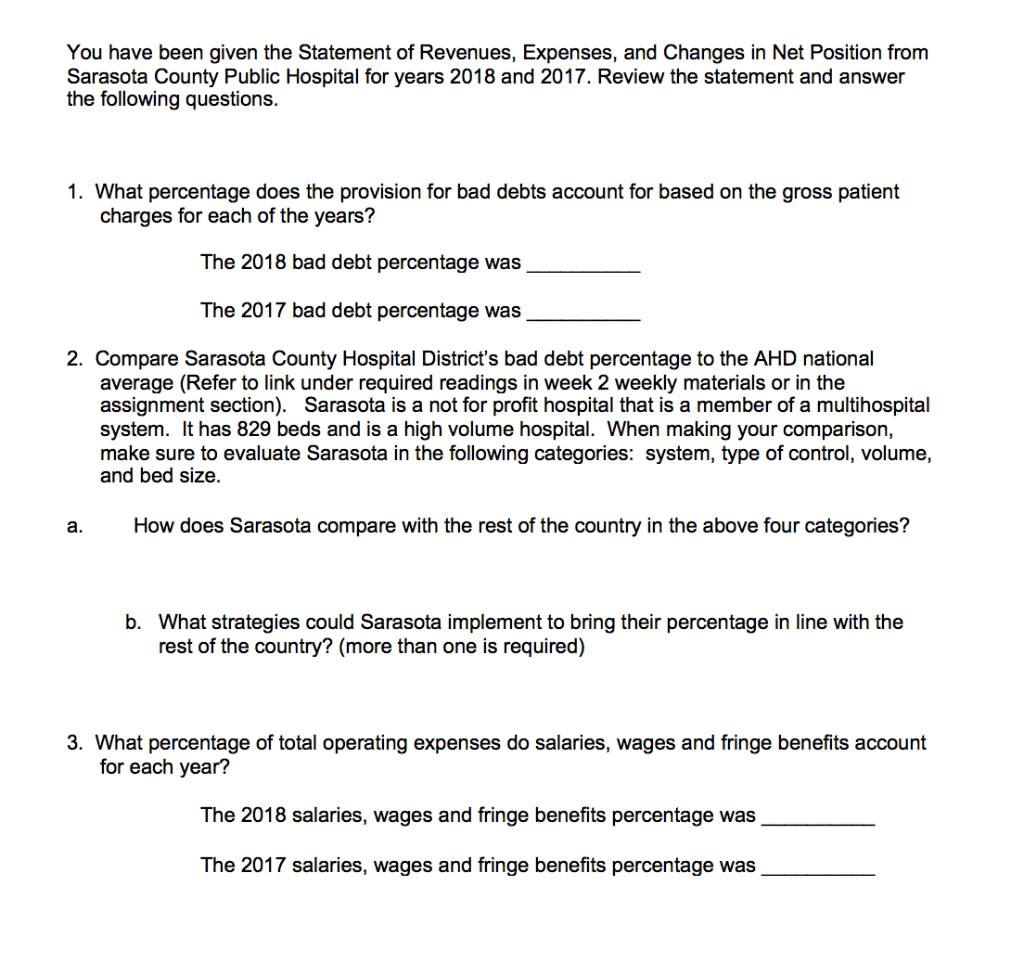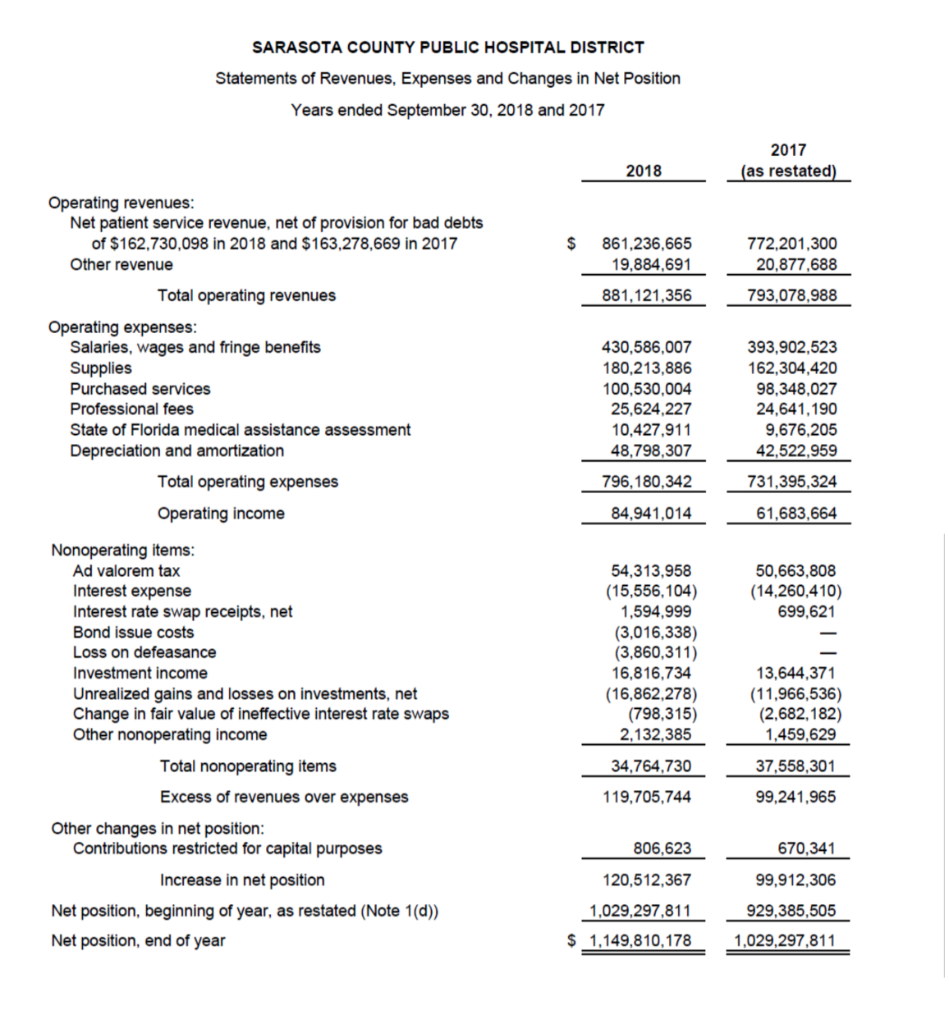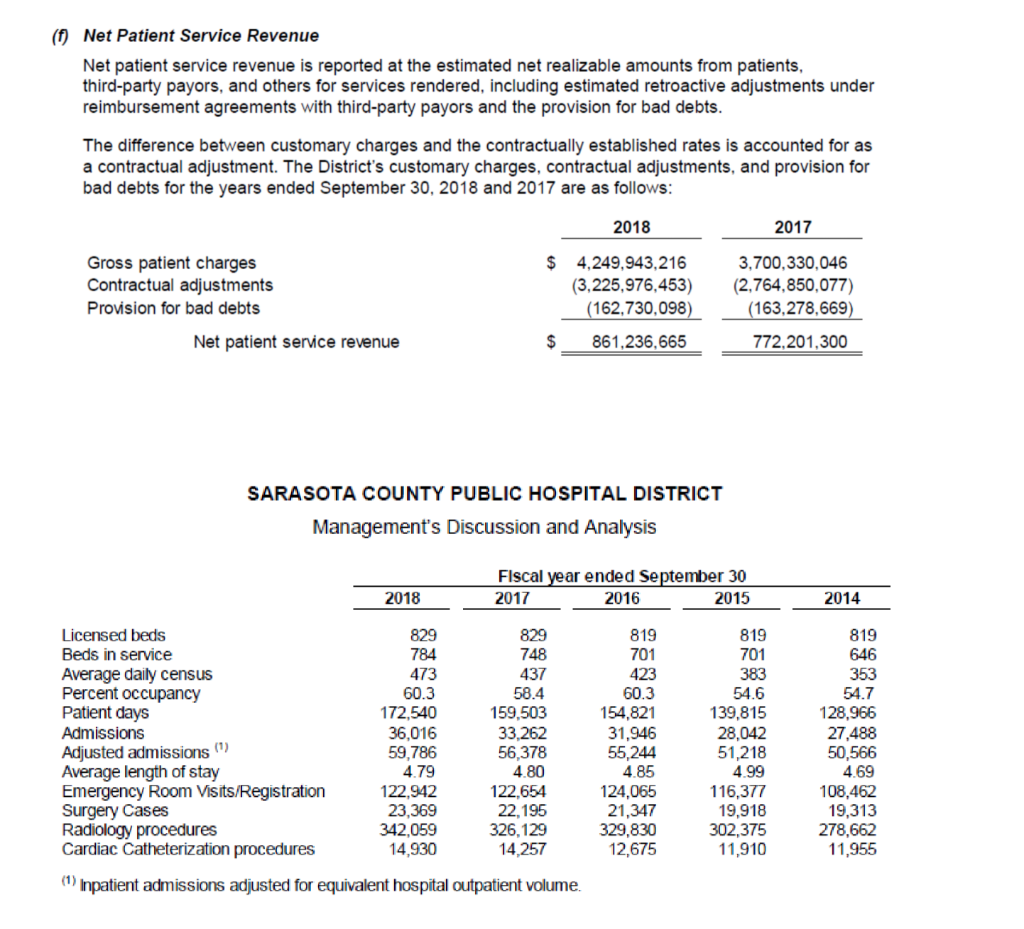


You have been given the Statement of Revenues, Expenses, and Changes in Net Position from Sarasota County Public Hospital for years 2018 and 2017. Review the statement and answer the following questions. 1. What percentage does the provision for bad debts account for based on the gross patient charges for each of the years? The 2018 bad debt percentage was The 2017 bad debt percentage was 2. Compare Sarasota County Hospital District's bad debt percentage to the AHD national average (Refer to link under required readings in week 2 weekly materials or in the assignment section). Sarasota is a not for profit hospital that is a member of a multihospital system. It has 829 beds and is a high volume hospital. When making your comparison, make sure to evaluate Sarasota in the following categories: system, type of control, volume, and bed size. How does Sarasota compare with the rest of the country in the above four categories? . b. What strategies could Sarasota implement to bring their percentage in line with the rest of the country? (more than one is required) 3. What percentage of total operating expenses do salaries, wages and fringe benefits account for each year? The 2018 salaries, wages and fringe benefits percentage was The 2017 salaries, wages and fringe benefits percentage was SARASOTA COUNTY PUBLIC HOSPITAL DISTRICT Statements of Revenues, Expenses and Changes in Net Position Years ended September 30, 2018 and 2017 2017 (as restated 2018 Operating revenues: Net patient service revenue, net of provision for bad debts of $162,730,098 in 2018 and $163,278,669 in 2017 $ 861,236,665 19,884,691 772,201,300 20,877,688 Other revenue 793,078,988 Total operating revenues 881,121,356 Operating expenses: Salaries, wages and fringe benefits Supplies Purchased services Professional fees 393,902,523 430,586,007 180,213,886 100,530,004 25,624,227 10,427,911 162,304,420 98.348,027 24,641,190 State of Florida medical assistance assessment 9,676,205 42,522,959 Depreciation and amortization 48,798,307 731,395 324 Total operating expenses 796,180,342 84,941,014 Operating income 61,683,664 Nonoperating items: Ad valorem tax nterest expense Interest rate swap receipts, net Bond issue costs 54,313,958 (15,556,104) 50,663,808 (14,260,410) 699,621 1,594,999 (3,016,338) (3,860,311) 16,816,734 Loss on defeasance Investment income 13,644,371 (16,862,278) (798,315) 2,132,385 Unrealized gains and losses on investments, net Change in fair value of ineffective interest rate swaps Other nonoperating income (11,966,536) (2,682,182) 1,459,629 34,764,730 Total nonoperating items 37,558,301 99,241,965 Excess of revenues over expenses 119,705,744 Other changes in net position: Contributions restricted for capital purposes 806,623 670,341 Increase in net position 120,512,367 99,912,306 929.385,505 Net position, beginning of year, as restated (Note 1(d)) 1,029,297,81 1 $ 1,149,810,1 78 Net position, end of year 1,029,297,81 1 (Net Patient Service Revenue Net patient service revenue is reported at the estimated net realizable amounts from patients, third-party payors, and others for services rendered, including estimated retroactive adjustments under reimbursement agreements with third-party payors and the provision for bad debts The difference between customary charges and the contractually established rates is accounted for as a contractual adjustment. The District's customary charges, contractual adjustments, and provision for bad debts for the years ended September 30, 2018 and 2017 are as follows: 2018 2017 Gross patient charges Contractual adjustments $ 4,249,943,216 3,700,330,046 (3,225,976,453) (162,730,098) (2,764,850,077) (163,278,669) Provision for bad debts $ 861,236,665 772,201,300 Net patient service revenue SARASOTA COUNTY PUBLIC HOSPITAL DISTRICT Management's Discussion and Analysis Flscal year ended September 30 2016 2017 2015 2014 2018 829 829 819 701 819 819 Licensed beds Beds in service Average daily census Percent occupancy Patient days Admissions 701 646 784 748 437 473 423 383 353 54.7 128,966 27,488 50,566 4.69 60.3 58.4 60.3 54.6 172,540 36,016 59.786 4.79 159,503 33,262 56,378 4.80 154,821 31,946 55,244 4.85 139,815 28,042 51,218 4.99 Adjusted admissions Average length of stay Emergency Room Visits/Registration Surgery Cases Radiology procedures Cardiac Catheterization procedures 122,942 23,369 342,059 14,930 122,654 22,195 326,129 14,257 124,065 21,347 329,830 12,675 116,377 19,918 302.375 11,910 108,462 19,313 278,662 11,955 (Inpatient admissions adjusted for equivalent hospital outpatient volume. You have been given the Statement of Revenues, Expenses, and Changes in Net Position from Sarasota County Public Hospital for years 2018 and 2017. Review the statement and answer the following questions. 1. What percentage does the provision for bad debts account for based on the gross patient charges for each of the years? The 2018 bad debt percentage was The 2017 bad debt percentage was 2. Compare Sarasota County Hospital District's bad debt percentage to the AHD national average (Refer to link under required readings in week 2 weekly materials or in the assignment section). Sarasota is a not for profit hospital that is a member of a multihospital system. It has 829 beds and is a high volume hospital. When making your comparison, make sure to evaluate Sarasota in the following categories: system, type of control, volume, and bed size. How does Sarasota compare with the rest of the country in the above four categories? . b. What strategies could Sarasota implement to bring their percentage in line with the rest of the country? (more than one is required) 3. What percentage of total operating expenses do salaries, wages and fringe benefits account for each year? The 2018 salaries, wages and fringe benefits percentage was The 2017 salaries, wages and fringe benefits percentage was SARASOTA COUNTY PUBLIC HOSPITAL DISTRICT Statements of Revenues, Expenses and Changes in Net Position Years ended September 30, 2018 and 2017 2017 (as restated 2018 Operating revenues: Net patient service revenue, net of provision for bad debts of $162,730,098 in 2018 and $163,278,669 in 2017 $ 861,236,665 19,884,691 772,201,300 20,877,688 Other revenue 793,078,988 Total operating revenues 881,121,356 Operating expenses: Salaries, wages and fringe benefits Supplies Purchased services Professional fees 393,902,523 430,586,007 180,213,886 100,530,004 25,624,227 10,427,911 162,304,420 98.348,027 24,641,190 State of Florida medical assistance assessment 9,676,205 42,522,959 Depreciation and amortization 48,798,307 731,395 324 Total operating expenses 796,180,342 84,941,014 Operating income 61,683,664 Nonoperating items: Ad valorem tax nterest expense Interest rate swap receipts, net Bond issue costs 54,313,958 (15,556,104) 50,663,808 (14,260,410) 699,621 1,594,999 (3,016,338) (3,860,311) 16,816,734 Loss on defeasance Investment income 13,644,371 (16,862,278) (798,315) 2,132,385 Unrealized gains and losses on investments, net Change in fair value of ineffective interest rate swaps Other nonoperating income (11,966,536) (2,682,182) 1,459,629 34,764,730 Total nonoperating items 37,558,301 99,241,965 Excess of revenues over expenses 119,705,744 Other changes in net position: Contributions restricted for capital purposes 806,623 670,341 Increase in net position 120,512,367 99,912,306 929.385,505 Net position, beginning of year, as restated (Note 1(d)) 1,029,297,81 1 $ 1,149,810,1 78 Net position, end of year 1,029,297,81 1 (Net Patient Service Revenue Net patient service revenue is reported at the estimated net realizable amounts from patients, third-party payors, and others for services rendered, including estimated retroactive adjustments under reimbursement agreements with third-party payors and the provision for bad debts The difference between customary charges and the contractually established rates is accounted for as a contractual adjustment. The District's customary charges, contractual adjustments, and provision for bad debts for the years ended September 30, 2018 and 2017 are as follows: 2018 2017 Gross patient charges Contractual adjustments $ 4,249,943,216 3,700,330,046 (3,225,976,453) (162,730,098) (2,764,850,077) (163,278,669) Provision for bad debts $ 861,236,665 772,201,300 Net patient service revenue SARASOTA COUNTY PUBLIC HOSPITAL DISTRICT Management's Discussion and Analysis Flscal year ended September 30 2016 2017 2015 2014 2018 829 829 819 701 819 819 Licensed beds Beds in service Average daily census Percent occupancy Patient days Admissions 701 646 784 748 437 473 423 383 353 54.7 128,966 27,488 50,566 4.69 60.3 58.4 60.3 54.6 172,540 36,016 59.786 4.79 159,503 33,262 56,378 4.80 154,821 31,946 55,244 4.85 139,815 28,042 51,218 4.99 Adjusted admissions Average length of stay Emergency Room Visits/Registration Surgery Cases Radiology procedures Cardiac Catheterization procedures 122,942 23,369 342,059 14,930 122,654 22,195 326,129 14,257 124,065 21,347 329,830 12,675 116,377 19,918 302.375 11,910 108,462 19,313 278,662 11,955 (Inpatient admissions adjusted for equivalent hospital outpatient volume


