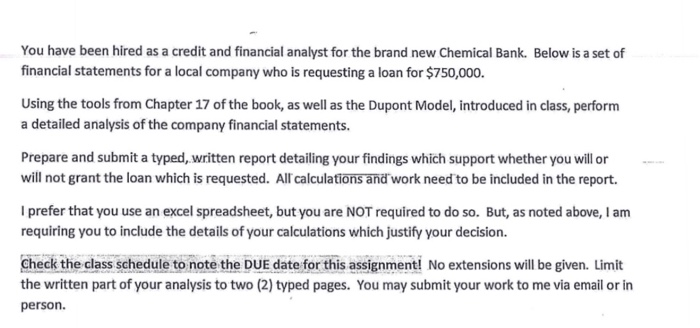
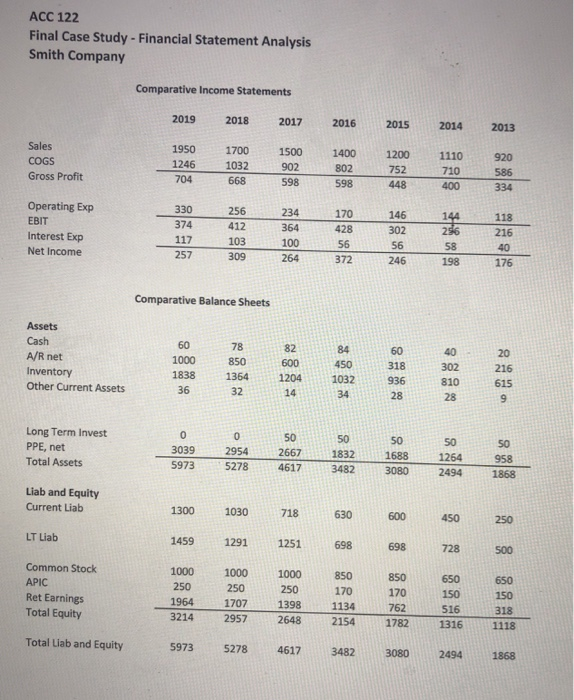
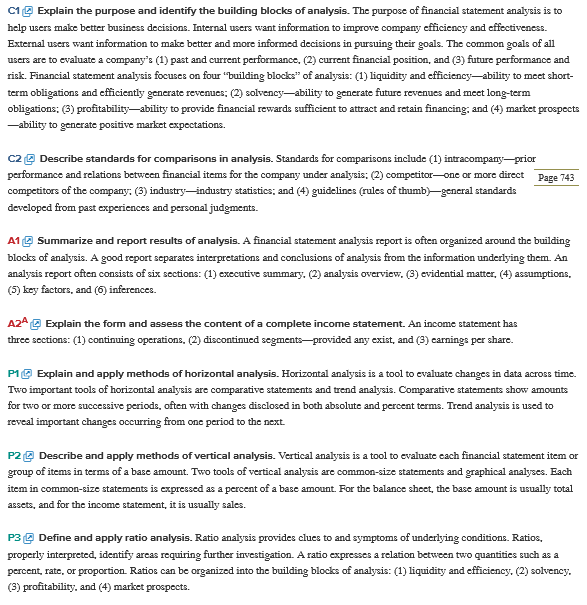
You have been hired as a credit and financial analyst for the brand new Chemical Bank. Below is a set of financial statements for a local company who is requesting a loan for $750,000. Using the tools from Chapter 17 of the book, as well as the Dupont Model, introduced in class, perform a detailed analysis of the company financial statements. Prepare and submit a typed, written report detailing your findings which support whether you will or will not grant the loan which is requested. Alf calculations and work need to be included in the report. I prefer that you use an excel spreadsheet, but you are NOT required to do so. But, as noted above, I am requiring you to include the details of your calculations which justify your decision. Check the class schedule to note the DUE date for this assignmenti No extensions will be given. Limit the written part of your analysis to two (2) typed pages. You may submit your work to me via email or in person. ACC 122 Final Case Study-Financial Statement Analysis Smith Company Comparative Income Statements 2019 2018 20131201 204 2013 1950 1700 1500 1400 1200 1110 920 802 598 1246 1032 668 902 598 752 710 586 Gross Profit Operating Exp EBIT Interest Exp Net Income 330 374 256 412 103 170 428 146 302 118 216 234 100 257 246 176 Comparative Balance Sheets Cash A/R net Inventory Other Current Assets 1000 850600 450 1838 1364 1204 1032936810 615 318 302216 36 Long Term Invest PPE, net Total Assets 3039 2954 26671832 5973 5278 4617 3482 3080 2494 1868 1688 1264 958 Liab and Equity Current Liab 1300 1030 718630 600 45o 250 1459 1291 1251 698 698 728 500 1000 1000 1000 850 8S0 650650 170 1134 LT Liab Common Stock 170 762 2648 2154 1782 1316 1118 150 516 150 318 Ret Earnings Total Equity 1964 3214 1707 2957 1398 Total Liab and Equity 5973 5278 4617 3482 3080 2494 1868 C1 Explain the purpose and identify the building blocks of analysis. The purpose of financial statement anaysis is to help users make better business decisions. Internal users want information to improve company efficiency and effectiveness. External users want information to make better and more informed decisions in pursuing their goals. The common goals of all users are to evaluate a company's (1) past and current performance, (2) current financial position, and (3) future performance and risk. Financial statement analysis focuses on four "building blocks" of analysis: (1) liquidity and efficiency-ability to meet short- term obligations and efficiently generate revenues: (2) solvency-ability to generate future revenues and meet long-term obligations: (3) profitability-ability to provide financial rewards sufficient to attract and retain financing: and (4) market prospects -ability to generate positive market expectations. C2 Describe standards for comparisons in analysis. Standards for comparisons include (1) intracompany prior performance and relations between financial items for the company under analysis; (2) competitor-one or more direct competitors of the company: (3) industry-industry statistics; and (4) guidelines (rules of thumb)-general standards developed from past experiences and personal judgments. Page 743 A1 Summarize and report results of analysis. A financial statement analysis report is often organized around the building blocks of analysis. A good report separates interpretations and conclusions of analysis from the information underlying them. An analysis report often consists of six sections: (1) executive summary, (2) analysis overview. (3) evidential matter, (4) assumptions, (5) key factors, and (6) inferences. A24Explain the form and assess the content of a complete income statement. An income statement has three sections: (1) continuing operations, (2) discontinued segments-provided any exist, and (3) carnings per share. P1 Explain and apply methods of horizontal analysis. Horizontal analysis is a tool to evaluate changes in data across time. Two important tools of horizontal analysis are comparative statements and trend analysis. Comparative statements show amounts for two or more successive periods, often with changes disclosed in both absolute and percent terms. Trend analysis is used to reveal important changes occurring from one period to the next. P2 Describe and apply methods of vertical analysis. Vertical analysis is a tool to evaluate each financial statement item or group of items in terms of a base amount. Two tools of vertical analysis are common-size statements and graphical analyses. Each item in common-size statements is expressed as a percent of a base amount. For the balance sheet, the base amount is usually total assets, and for the income statement, it is usually sales. P3Define and apply ratio analysis. Ratio anaysis provides clues to and symptoms of underlying conditions. Ratios, properly interpreted, identify areas requiring further investigation. A ratio expresses a relation between two quantities such as a percent, rate, or proportion. Ratios can be organized into the building blocks of analysis: (1) liquidity and efficiency, (2) solvency. (3) profitability, and (4) market prospects. ANALYSIS OF FINANCIAL STATEMENTS CHAPTER PREVIEW BASICS OF ANALYSIS Analysis purpose building blocks C2Standards for comparisons Analysis tools HORIZONTAL ANALYSIS P Application of Comparative balance sheets Comparative income statements Trend analysis NTK 17-1 VERTICAL ANALYSIS PApplication of. Common-size balance sheet Common-size income statement Common-size graphics NTK 17-2 HORIZONTAL ANALYSIS Application of. Comparative balance sheets Comparative income statements Trend analysis NTK 17-1 VERTICAL ANALYSIS PApplication of. Common-size balance sheet Common-size income statement Common-size graphics NTK 17-2 RATIO ANALYSIS AND REPORTING P3Liquidity and efficiency Solvency Profitability Market prospects 1 Analysis reports NTK 17-3 You have been hired as a credit and financial analyst for the brand new Chemical Bank. Below is a set of financial statements for a local company who is requesting a loan for $750,000. Using the tools from Chapter 17 of the book, as well as the Dupont Model, introduced in class, perform a detailed analysis of the company financial statements. Prepare and submit a typed, written report detailing your findings which support whether you will or will not grant the loan which is requested. Alf calculations and work need to be included in the report. I prefer that you use an excel spreadsheet, but you are NOT required to do so. But, as noted above, I am requiring you to include the details of your calculations which justify your decision. Check the class schedule to note the DUE date for this assignmenti No extensions will be given. Limit the written part of your analysis to two (2) typed pages. You may submit your work to me via email or in person. ACC 122 Final Case Study-Financial Statement Analysis Smith Company Comparative Income Statements 2019 2018 20131201 204 2013 1950 1700 1500 1400 1200 1110 920 802 598 1246 1032 668 902 598 752 710 586 Gross Profit Operating Exp EBIT Interest Exp Net Income 330 374 256 412 103 170 428 146 302 118 216 234 100 257 246 176 Comparative Balance Sheets Cash A/R net Inventory Other Current Assets 1000 850600 450 1838 1364 1204 1032936810 615 318 302216 36 Long Term Invest PPE, net Total Assets 3039 2954 26671832 5973 5278 4617 3482 3080 2494 1868 1688 1264 958 Liab and Equity Current Liab 1300 1030 718630 600 45o 250 1459 1291 1251 698 698 728 500 1000 1000 1000 850 8S0 650650 170 1134 LT Liab Common Stock 170 762 2648 2154 1782 1316 1118 150 516 150 318 Ret Earnings Total Equity 1964 3214 1707 2957 1398 Total Liab and Equity 5973 5278 4617 3482 3080 2494 1868 C1 Explain the purpose and identify the building blocks of analysis. The purpose of financial statement anaysis is to help users make better business decisions. Internal users want information to improve company efficiency and effectiveness. External users want information to make better and more informed decisions in pursuing their goals. The common goals of all users are to evaluate a company's (1) past and current performance, (2) current financial position, and (3) future performance and risk. Financial statement analysis focuses on four "building blocks" of analysis: (1) liquidity and efficiency-ability to meet short- term obligations and efficiently generate revenues: (2) solvency-ability to generate future revenues and meet long-term obligations: (3) profitability-ability to provide financial rewards sufficient to attract and retain financing: and (4) market prospects -ability to generate positive market expectations. C2 Describe standards for comparisons in analysis. Standards for comparisons include (1) intracompany prior performance and relations between financial items for the company under analysis; (2) competitor-one or more direct competitors of the company: (3) industry-industry statistics; and (4) guidelines (rules of thumb)-general standards developed from past experiences and personal judgments. Page 743 A1 Summarize and report results of analysis. A financial statement analysis report is often organized around the building blocks of analysis. A good report separates interpretations and conclusions of analysis from the information underlying them. An analysis report often consists of six sections: (1) executive summary, (2) analysis overview. (3) evidential matter, (4) assumptions, (5) key factors, and (6) inferences. A24Explain the form and assess the content of a complete income statement. An income statement has three sections: (1) continuing operations, (2) discontinued segments-provided any exist, and (3) carnings per share. P1 Explain and apply methods of horizontal analysis. Horizontal analysis is a tool to evaluate changes in data across time. Two important tools of horizontal analysis are comparative statements and trend analysis. Comparative statements show amounts for two or more successive periods, often with changes disclosed in both absolute and percent terms. Trend analysis is used to reveal important changes occurring from one period to the next. P2 Describe and apply methods of vertical analysis. Vertical analysis is a tool to evaluate each financial statement item or group of items in terms of a base amount. Two tools of vertical analysis are common-size statements and graphical analyses. Each item in common-size statements is expressed as a percent of a base amount. For the balance sheet, the base amount is usually total assets, and for the income statement, it is usually sales. P3Define and apply ratio analysis. Ratio anaysis provides clues to and symptoms of underlying conditions. Ratios, properly interpreted, identify areas requiring further investigation. A ratio expresses a relation between two quantities such as a percent, rate, or proportion. Ratios can be organized into the building blocks of analysis: (1) liquidity and efficiency, (2) solvency. (3) profitability, and (4) market prospects. ANALYSIS OF FINANCIAL STATEMENTS CHAPTER PREVIEW BASICS OF ANALYSIS Analysis purpose building blocks C2Standards for comparisons Analysis tools HORIZONTAL ANALYSIS P Application of Comparative balance sheets Comparative income statements Trend analysis NTK 17-1 VERTICAL ANALYSIS PApplication of. Common-size balance sheet Common-size income statement Common-size graphics NTK 17-2 HORIZONTAL ANALYSIS Application of. Comparative balance sheets Comparative income statements Trend analysis NTK 17-1 VERTICAL ANALYSIS PApplication of. Common-size balance sheet Common-size income statement Common-size graphics NTK 17-2 RATIO ANALYSIS AND REPORTING P3Liquidity and efficiency Solvency Profitability Market prospects 1 Analysis reports NTK 17-3