You have been hired by Internal Business Machines Corporation (IBM) in their capital budgeting division. Your first assignment is to determine the free cash flows and NPV of a proposed new type of tablet computer similar in size to an iPad but with the operating power of a high-end desktop system. Development of the new system will initially require an initial capital expenditure equal to 10% of IBMs Property, Plant, and Equipment (PPE) at the end of the latest fiscal year for which data is available. The project will then require an additional investment equal to 10% of the initial in-vestment after the first year of the project, a 5% increase after the second year, and a 1% increase after the third, fourth, and fifth years. The product is expected to have a life of five years. First-year revenues for the new product are expected to be 3% of IBMs total revenue for the latest fiscal year for which data is available. The new products revenues are expected to grow at 15% for the second year then 10% for the third and 5% annually for the final two years of the expected life of the project. Your job is to determine the rest of the cash flows associated with this project. Your boss has indicated that the operating costs and net working capital requirements are similar to the rest of the company and that depreciation is straight-line for capital budgeting purposes. 1. (8 points) Compute the Free Cash Flow for each year. a. Assume that the projects profitability will be similar to IBMs existing projects in the latest fiscal year and estimate (revenues - costs) each year by using the latest EBITDA/Sales profit margin. Calculate EBITDA as EBIT + Depreciation expense from the cash flow statement. b. Determine the annual depreciation by assuming IBM depreciates these assets by the straight-line method over a five-year life. c. Calculate the net working capital required each year by assuming that the level of NWC will be a constant percentage of the projects sales. Use IBMs NWC/Sales for the latest fiscal year to estimate the required percentage. (Use only accounts receivable, accounts payable, and inventory to measure working capital. Other components of current assets and liabilities are harder to interpret and not necessarily reflective of the projects required NWCfor example, IBMs cash holdings.) d. To determine the free cash flow, deduct the additional capital investment and the change in net working capital each year. 2. (4 points) Use Excel to determine the NPV of the project with a 12% cost of capital. Also calculate the IRR of the project using Excels IRR function. 3. (6 points) Perform a sensitivity analysis by varying the project forecasts as follows: a. Suppose first year sales will equal 2%4% of IBMs revenues. b. Suppose the cost of capital is 10%15%. c. Suppose revenue growth is constant after the first year at a rate of 0%10%
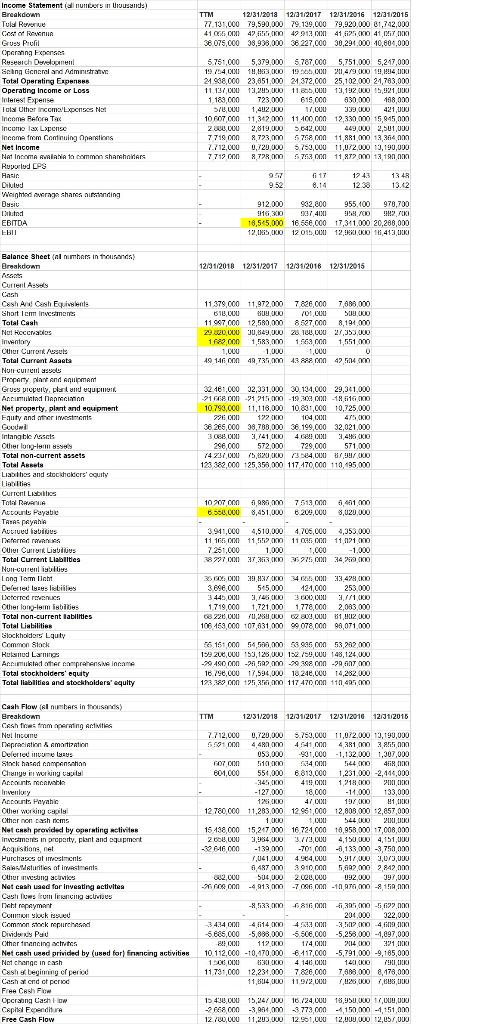
TTM 12/31/2018 12/31/2017 12/31/2016 12/31/2015 77. 131,000 79,590,000 79.139,000 79,920,000 81,742,000 4105 000 47,155,000 47912001141,625,000 41,07 DOO 38 075,000 38,933,000 36 227,000 30,291.000 10,604,000 Income Statement al CTS in Urusands) Breakdown Tula Rune Cost of Ruin Gruss Profil Operang Epens Research Development Scing General and Administrative Total Operating Expenses Operating Income or Loss Interest Expense Tois Other incomo/Lxpenses Nel Income Before Tak Income Tax Lxpense Income from Continuing nantins Net Income Net IncomA RRIANA to common sharhians Ruporld Cog Hasin Diluted Weighted average shares intending Dusiv Leband EBITDA EBI 5.75,000 5,379.000 5.787,000 5,751.000 5,247,000 19 19./14.00 14.53 KIO 1925.00 2014/90 19,2014 OCI 24 998.000 23,951,000 24 372,000 25,102.000 21,763,000 11.137,000 13,245 000 11805,000 13,19200 15,921 LIKU 1.183.000 723.000 615.000 630.000 198.000 57 COU 1,442,000 17.00u 339.000 421 0 10607.000 11,342.000 11.400,000 12,330,000 15,045,000 ZO.000 2,819,000 5642.000 2014 449,000 2,501,000 7 718 000 2,723.000 5758 000 11 881.000 13,304 000 7.712.000 0.720.000 5.759.000 11,082,000 10,190,000 7 719 000 8.72R600 5753 00 11 T2 0 13 19 000 917 9.52 fi 17 8.14 12 4.3 12.30 13 4R 13.12 912.000 902,800 955.100 978,700 9116320 907,41011 91.8.700 !142, KI 18.5-5.000 16 660.000 17,311.000 20,200,000 12,085 OCIO 12 015001 12,9KI OCIO 11,413 KI Balance Sheetal numbers in thousands Breakdown 12/31/2018 12/31/2017 12/01/2018 12/31/2015 11.379,000 11,972,000 7826,000 7,800,000 618000 BOUKO 101,000 500 OK 11 607.000 12,580.000 8527 con 8,194.000 230000 30,829,000 20 TW COU 28,353,000 1689.000 1,583.000 1969.000 1,551.000 1.000 1.000 1,000 0 49 146 CON 49,735,000 4328 CON 42 54.000 10.122 0 32181.000 32,331.000 30.134,000 29,361,000 21 668 00 -21, 21500 - 19.308 00 -18.616.000 10793,000 11,118,000 1081,000 10,725.000 104 CM 475.000 36 265,000 38,788.000 36 199,000 32,021.000 36880X1,741 KIO 46 3,496 KIO 296.000 572000 729.000 571.000 74 237,000 5,6200 13584,000 8,097 000 123 382,000 125,350,000 117-170,000 110,95.000 Current Assos Cash Cash And Cash Equivalents Shortier investments Total Cash Not Heccables Inventary Cur Curront resets Total Current Assets Non currently Property and AMAN Gruss properly launduque Anuntud nation Net property, plant and equipment Fauty and other itens Goodwi Intangible Assets Other long-lem Total non-current assets Total Arrats Liables and stockholders' cguity Lian Current Lisbiblics res Total RARIA Account Payable TATALAYALA Accrued abus Deferred Our Current Lisbils Total Current Liabilties Null-curren iblis Long Tam Licht Deferred to slicabilities Ectcrred on Other long-larm inbillas Total non-current abilities Total Liabilities Glockholders Luty Common Stock Hotted Lamins And the comprehensive Incame Total stockholders' equity Total liabilities and stockholders' equity 10 207 con 51087 000 6.560.000 8,451,000 7513 7.513,000 640100 6209,000 8,020.000 3911,000 4,510.000 4700,000 4.706,000 4,353.000 11 165 000 11,552.000 11 05.000 11.121.000 7.251,000 1.000 1,000 -1.000 8227000 27 23 O 2750 34,270 CXO 3500X 39,937 KIO 463500 33,478 KIO 3696,000 55,000 121,000 255 000 3445,000 3,146 KIO 3 000,00 3.1/ 10 1719,000 1,721,000 1778,000 2,083.000 68 220.000 0,26 KO BAXI,000 1,112 106.459.000 107,631,000 99 078 000 98.071.000 55 154000 54,588.000 53.945,000 53,282,000 199 200,00U 153,125,000 152 759,00U 148,124,000 -20-450 COD -29,522,000 -79308.00 -79,907.000 16.790,000 17,594,000 10240,00U 14,282,000 123,389 CON 125 354,000 117.470000 110,495.000 TTM 12/31/2018 12/31/2017 12/31/2016 12/31/2016 Cash Flow aluthers in ) Breakdown Cash fires immering Ant Nel Income Depreciation & Amortization Deferred more lys Stockhased nomination Change in working i As cambi Inventory Accounts Payahic Other working color Cither non cash rims Net cash provided by operating activites invest in property, plant and equpment Acquisitions, nel Purchases olimesicnis SAS Matures of instant Our resung SMS Net cash used for investing activites Castillows from lancing SMD Det repeyman Como eu Common reprehend Dividers Pau Other trancing the Net cash and privided by used for) financing activities Not change in cash Cashebeyiming of period Cash atond er period Free Cash Flow LECT 3in1 Cart | tik Capital Fendir Free Cash Flow 7.712,000 0,720,000 5.750,000 11,072,000 13,190,000 591 00 4,480.000 4.541 con 43810 3 ani 053,000 901,000 -1,132,000 1,307,000 607.000 510 000 934 00 5,24 KIO 419 DEKO 601,000 550,000 6813,000 1,231.000 -2,445,000 345 4190XX1 1,218 KIO 2001 DKI -127.000 18,000 -11,000 133,000 128KO 47001 197 IO H1 HKI 12 780,000 11,283.000 12.961,000 12,808.000 12,857,000 1 KO 1,00 544 KD 200,000 15:438,000 15,217.000 16 724,000 10,958.000 17,008,000 200 000 3,984,000 {", CCNI 4,190 000 4,151,000 -326-16.000 -139.000 -701,con -4,133,000 -3,750,000 8,041,000 4 964,000 5,917,000 3,0/3,000 E14RT 00 3910 000 5992,000 2,842.000 w W32,000 504 000 2.000.000 192.000 397,000 -26 FOSCO -4913 -706 On-1nt - 19.00 -8.533.000 -681600 - 3951 1920 200.000 322.000 3434 CM -4.614.000 49223001 35.112 4.01 BKI 5685,000 -5,888.000 -6.506,000 -5,258.000 -1,897,000 XI 112 KIO 174 XXI 2014 000 221 DIRI 10.112,000 -10,170,000 -6 117,000 -5,791.000 -9,165,000 10.000 3301 KIO 4146 0001 14. KO SKICKA 11 73,000 12,234.000 7826.000 7,688,000 8,178,000 11,804 000 11.912.000 1,026 000 7,068,000 15418.000 15,247,000 16.724,000 15,950 000 14,000,00 -2 668 000 3,004,000 -3,984.000 3773,000 -1,150,000 -1,151,000 12 700,000 11,205,000 12.901,00 12,000,000 12,057,000 TTM 12/31/2018 12/31/2017 12/31/2016 12/31/2015 77. 131,000 79,590,000 79.139,000 79,920,000 81,742,000 4105 000 47,155,000 47912001141,625,000 41,07 DOO 38 075,000 38,933,000 36 227,000 30,291.000 10,604,000 Income Statement al CTS in Urusands) Breakdown Tula Rune Cost of Ruin Gruss Profil Operang Epens Research Development Scing General and Administrative Total Operating Expenses Operating Income or Loss Interest Expense Tois Other incomo/Lxpenses Nel Income Before Tak Income Tax Lxpense Income from Continuing nantins Net Income Net IncomA RRIANA to common sharhians Ruporld Cog Hasin Diluted Weighted average shares intending Dusiv Leband EBITDA EBI 5.75,000 5,379.000 5.787,000 5,751.000 5,247,000 19 19./14.00 14.53 KIO 1925.00 2014/90 19,2014 OCI 24 998.000 23,951,000 24 372,000 25,102.000 21,763,000 11.137,000 13,245 000 11805,000 13,19200 15,921 LIKU 1.183.000 723.000 615.000 630.000 198.000 57 COU 1,442,000 17.00u 339.000 421 0 10607.000 11,342.000 11.400,000 12,330,000 15,045,000 ZO.000 2,819,000 5642.000 2014 449,000 2,501,000 7 718 000 2,723.000 5758 000 11 881.000 13,304 000 7.712.000 0.720.000 5.759.000 11,082,000 10,190,000 7 719 000 8.72R600 5753 00 11 T2 0 13 19 000 917 9.52 fi 17 8.14 12 4.3 12.30 13 4R 13.12 912.000 902,800 955.100 978,700 9116320 907,41011 91.8.700 !142, KI 18.5-5.000 16 660.000 17,311.000 20,200,000 12,085 OCIO 12 015001 12,9KI OCIO 11,413 KI Balance Sheetal numbers in thousands Breakdown 12/31/2018 12/31/2017 12/01/2018 12/31/2015 11.379,000 11,972,000 7826,000 7,800,000 618000 BOUKO 101,000 500 OK 11 607.000 12,580.000 8527 con 8,194.000 230000 30,829,000 20 TW COU 28,353,000 1689.000 1,583.000 1969.000 1,551.000 1.000 1.000 1,000 0 49 146 CON 49,735,000 4328 CON 42 54.000 10.122 0 32181.000 32,331.000 30.134,000 29,361,000 21 668 00 -21, 21500 - 19.308 00 -18.616.000 10793,000 11,118,000 1081,000 10,725.000 104 CM 475.000 36 265,000 38,788.000 36 199,000 32,021.000 36880X1,741 KIO 46 3,496 KIO 296.000 572000 729.000 571.000 74 237,000 5,6200 13584,000 8,097 000 123 382,000 125,350,000 117-170,000 110,95.000 Current Assos Cash Cash And Cash Equivalents Shortier investments Total Cash Not Heccables Inventary Cur Curront resets Total Current Assets Non currently Property and AMAN Gruss properly launduque Anuntud nation Net property, plant and equipment Fauty and other itens Goodwi Intangible Assets Other long-lem Total non-current assets Total Arrats Liables and stockholders' cguity Lian Current Lisbiblics res Total RARIA Account Payable TATALAYALA Accrued abus Deferred Our Current Lisbils Total Current Liabilties Null-curren iblis Long Tam Licht Deferred to slicabilities Ectcrred on Other long-larm inbillas Total non-current abilities Total Liabilities Glockholders Luty Common Stock Hotted Lamins And the comprehensive Incame Total stockholders' equity Total liabilities and stockholders' equity 10 207 con 51087 000 6.560.000 8,451,000 7513 7.513,000 640100 6209,000 8,020.000 3911,000 4,510.000 4700,000 4.706,000 4,353.000 11 165 000 11,552.000 11 05.000 11.121.000 7.251,000 1.000 1,000 -1.000 8227000 27 23 O 2750 34,270 CXO 3500X 39,937 KIO 463500 33,478 KIO 3696,000 55,000 121,000 255 000 3445,000 3,146 KIO 3 000,00 3.1/ 10 1719,000 1,721,000 1778,000 2,083.000 68 220.000 0,26 KO BAXI,000 1,112 106.459.000 107,631,000 99 078 000 98.071.000 55 154000 54,588.000 53.945,000 53,282,000 199 200,00U 153,125,000 152 759,00U 148,124,000 -20-450 COD -29,522,000 -79308.00 -79,907.000 16.790,000 17,594,000 10240,00U 14,282,000 123,389 CON 125 354,000 117.470000 110,495.000 TTM 12/31/2018 12/31/2017 12/31/2016 12/31/2016 Cash Flow aluthers in ) Breakdown Cash fires immering Ant Nel Income Depreciation & Amortization Deferred more lys Stockhased nomination Change in working i As cambi Inventory Accounts Payahic Other working color Cither non cash rims Net cash provided by operating activites invest in property, plant and equpment Acquisitions, nel Purchases olimesicnis SAS Matures of instant Our resung SMS Net cash used for investing activites Castillows from lancing SMD Det repeyman Como eu Common reprehend Dividers Pau Other trancing the Net cash and privided by used for) financing activities Not change in cash Cashebeyiming of period Cash atond er period Free Cash Flow LECT 3in1 Cart | tik Capital Fendir Free Cash Flow 7.712,000 0,720,000 5.750,000 11,072,000 13,190,000 591 00 4,480.000 4.541 con 43810 3 ani 053,000 901,000 -1,132,000 1,307,000 607.000 510 000 934 00 5,24 KIO 419 DEKO 601,000 550,000 6813,000 1,231.000 -2,445,000 345 4190XX1 1,218 KIO 2001 DKI -127.000 18,000 -11,000 133,000 128KO 47001 197 IO H1 HKI 12 780,000 11,283.000 12.961,000 12,808.000 12,857,000 1 KO 1,00 544 KD 200,000 15:438,000 15,217.000 16 724,000 10,958.000 17,008,000 200 000 3,984,000 {", CCNI 4,190 000 4,151,000 -326-16.000 -139.000 -701,con -4,133,000 -3,750,000 8,041,000 4 964,000 5,917,000 3,0/3,000 E14RT 00 3910 000 5992,000 2,842.000 w W32,000 504 000 2.000.000 192.000 397,000 -26 FOSCO -4913 -706 On-1nt - 19.00 -8.533.000 -681600 - 3951 1920 200.000 322.000 3434 CM -4.614.000 49223001 35.112 4.01 BKI 5685,000 -5,888.000 -6.506,000 -5,258.000 -1,897,000 XI 112 KIO 174 XXI 2014 000 221 DIRI 10.112,000 -10,170,000 -6 117,000 -5,791.000 -9,165,000 10.000 3301 KIO 4146 0001 14. KO SKICKA 11 73,000 12,234.000 7826.000 7,688,000 8,178,000 11,804 000 11.912.000 1,026 000 7,068,000 15418.000 15,247,000 16.724,000 15,950 000 14,000,00 -2 668 000 3,004,000 -3,984.000 3773,000 -1,150,000 -1,151,000 12 700,000 11,205,000 12.901,00 12,000,000 12,057,000