Answered step by step
Verified Expert Solution
Link Copied!

Question

1 Approved Answer

You have been working long and hard on your schoolwork and need a break, so you decide to do something fun and create a MATLAB

You have been working long and hard on your schoolwork and need a break, so you decide to do something fun and create a MATLAB program for a new arcade game. In this game, you are aiming at two circles and two rectangles that are moving around the screen and are changing size and point values throughout the game. The objective is to hit the shape with the highest point value.
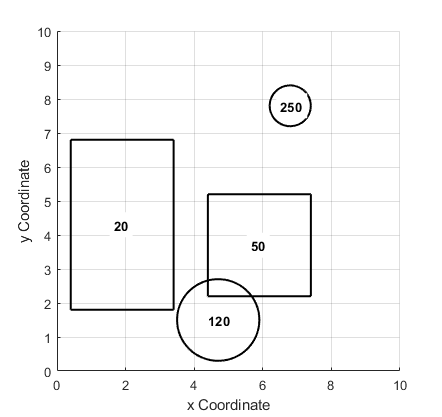
image text in transcribed

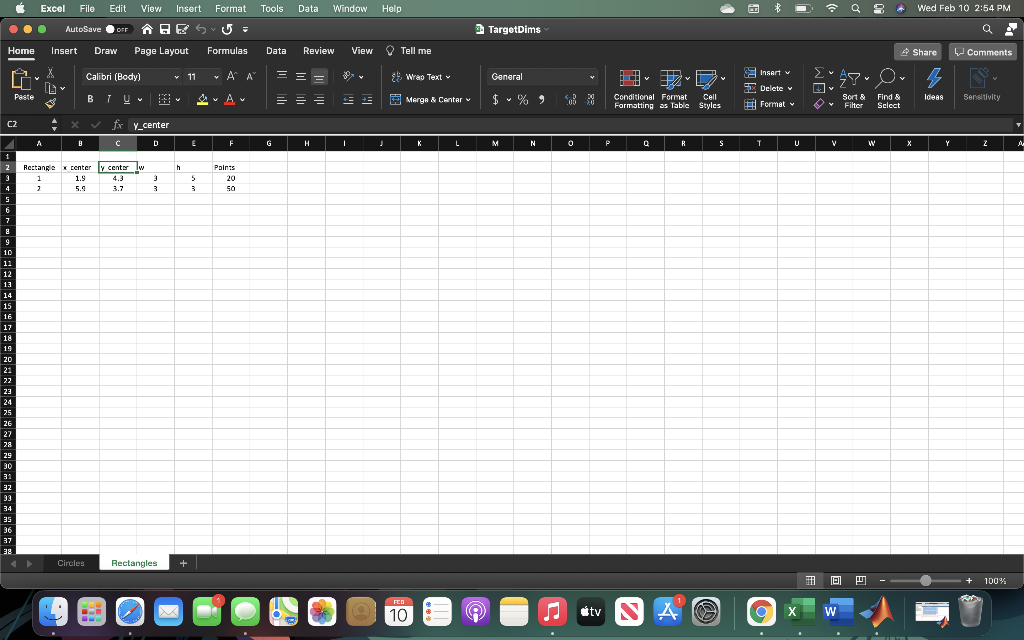
The center coordinates, point values, and radius/dimensions for the circles and rectangles at the time of a shot are listed in the Excel Workbook TargetDims.xlsx. Write a program that will import the data as tables from Excel and determine the number of points achieved for any single set of coordinates (input in x and y). Write the code such that when the values in the Excel spreadsheet (such as center location, dimensions, points, etc.) change, the program would still function correctly. You may assume that the column names of the Excel spreadsheet will always remain the same and that there will always be two circles and two rectangles.

Coordinates that fall in or on the edge of a shape are included in the point value of that shape. If multiple shapes overlap at any point, the default area is the one with the higher point value. Any coordinate outside all the shapes earns 0 points. You may assume that circles always have a higher point value than rectangles, but the circles and rectangles will not always be in the same order in the Excel file (i.e., sometimes circle 1 will have the higher point value but other times circle 2 may have the higher point value). Therefore, you must organize the shape data in order of point value in MATLAB before classification.

Excel Graphs:
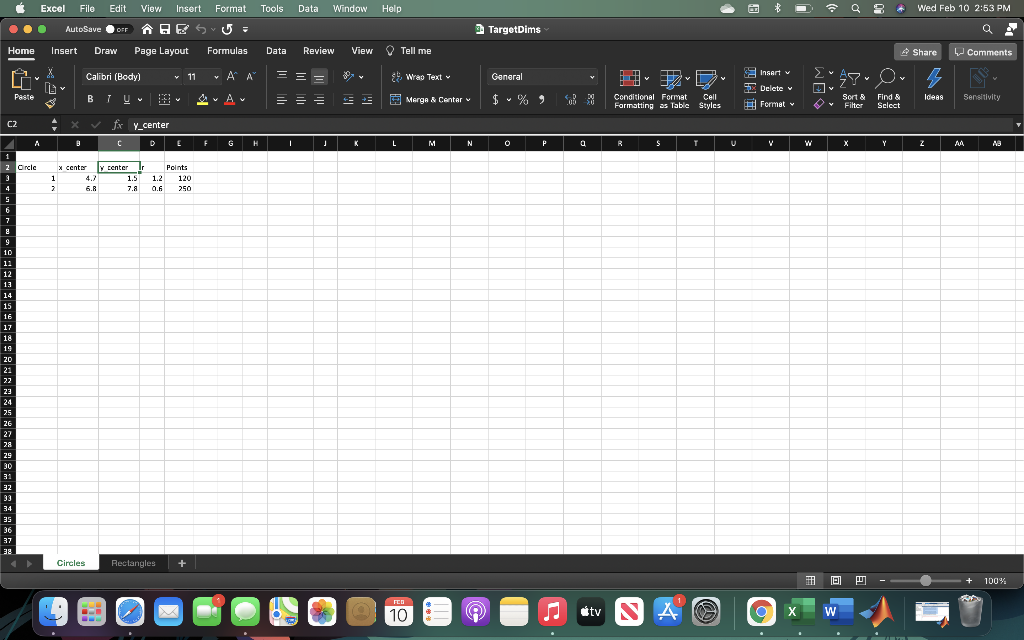
image text in transcribed

image text in transcribed

10 9 8 250 7 6 y Coordinate 20 50 3 2 120 1 0 0 N 8 10 4 6 x Coordinate Excel File Edit View Insert Format Tools Data Window Help Wed Feb 10 2:53 PM AutoSave OFF HE TargetDims Home Insert Draw Page Layout Formulas Data Review View Tell me Share Comments Calibri (Body) V 11 VA AI == Insert v General Y 9. Wao Text 3 Delete Paste Z Sort & Filter B TU = == Mergo & Center v Conditional Format Cell Formatting as Table Styles Find & Select Sensitivity ! Format C2 x Y_center A C E F H T L M N a R S T V w Y Z z 1 2 Circle 3 x center y center 1 4.7 1.5 7 6.8 7.8 1.2 0.6 Points 120 250 S 6 7 9 10 11 12 13 14 15 16 17 18 19 20 21 22 23 24 25 26 27 28 29 30 31 32 34 35 36 37 319 Circles Rectangles + je ) 100% FLD 10 9 etv NA X W Excel File Edit View Insert Format Tools Data Window Help Wed Feb 10 2:54 PM AutoSave OFF HE TargetDims Home Insert Draw Page Layout Formulas Data Review View Tell me Share Comments Calibri (Body) > V 11 AP == General Y 9. Wao Text Y Insert v Delete Format 3 Paste = = = Z Sort & Filter Merge & Centar Conditional Format Formatting as Table Cell Styles Find & Select Sensitivity C2 x Y_center A C D E F H I K L M N 0 P 0 R S T U V W X Y Z A 1 ly h Rectangle center 1 1.9 2 5.9 center lw 4.3 3 3 3. 5 5 Paints 20 so 50 5 6 7 9 10 11 12 13 14 15 16 17 18 19 20 21 22 23 24 25 26 27 28 29 30 31 32 34 35 36 37 Circles Rectangles + je ) 100% FLD 10 9 etv NA W 10 9 8 250 7 6 y Coordinate 20 50 3 2 120 1 0 0 N 8 10 4 6 x Coordinate Excel File Edit View Insert Format Tools Data Window Help Wed Feb 10 2:53 PM AutoSave OFF HE TargetDims Home Insert Draw Page Layout Formulas Data Review View Tell me Share Comments Calibri (Body) V 11 VA AI == Insert v General Y 9. Wao Text 3 Delete Paste Z Sort & Filter B TU = == Mergo & Center v Conditional Format Cell Formatting as Table Styles Find & Select Sensitivity ! Format C2 x Y_center A C E F H T L M N a R S T V w Y Z z 1 2 Circle 3 x center y center 1 4.7 1.5 7 6.8 7.8 1.2 0.6 Points 120 250 S 6 7 9 10 11 12 13 14 15 16 17 18 19 20 21 22 23 24 25 26 27 28 29 30 31 32 34 35 36 37 319 Circles Rectangles + je ) 100% FLD 10 9 etv NA X W Excel File Edit View Insert Format Tools Data Window Help Wed Feb 10 2:54 PM AutoSave OFF HE TargetDims Home Insert Draw Page Layout Formulas Data Review View Tell me Share Comments Calibri (Body) > V 11 AP == General Y 9. Wao Text Y Insert v Delete Format 3 Paste = = = Z Sort & Filter Merge & Centar Conditional Format Formatting as Table Cell Styles Find & Select Sensitivity C2 x Y_center A C D E F H I K L M N 0 P 0 R S T U V W X Y Z A 1 ly h Rectangle center 1 1.9 2 5.9 center lw 4.3 3 3 3. 5 5 Paints 20 so 50 5 6 7 9 10 11 12 13 14 15 16 17 18 19 20 21 22 23 24 25 26 27 28 29 30 31 32 34 35 36 37 Circles Rectangles + je ) 100% FLD 10 9 etv NA W

Step by Step Solution

There are 3 Steps involved in it

Step: 1

blur-text-image

Get Instant Access to Expert-Tailored Solutions

See step-by-step solutions with expert insights and AI powered tools for academic success

Step: 2

blur-text-image_2

Step: 3

blur-text-image_3

Ace Your Homework with AI

Get the answers you need in no time with our AI-driven, step-by-step assistance

Get Started

Recommended Textbook for

Database Systems Design Implementation And Management

Authors: Peter Robb,Carlos Coronel

5th Edition

061906269X, 9780619062699

More Books

Students also viewed these Databases questions

Question

Explain five .reasons why incentive plans fail.

Answered: 1 week ago