You have been working Ms. Sanchez at YVMDC. She has asked you to prepare a monthly cash budget for FY 2017 . At the very minimum, your cash budget should report cash inflows from receivables, cash outflows, and cash balances at the end of each month.
She has also asked you to prepare proforma financial statements including the Statement of Financial Position and a Statement of Activities
You expect to meet with her to discuss your estimates and related analysis. Prepare a brief memo that summarizes the clinics operations for the year. Be sure to highlight the strengths and weaknesses of YVMDC cash flows, operating performance, and financial position for FY 2017.
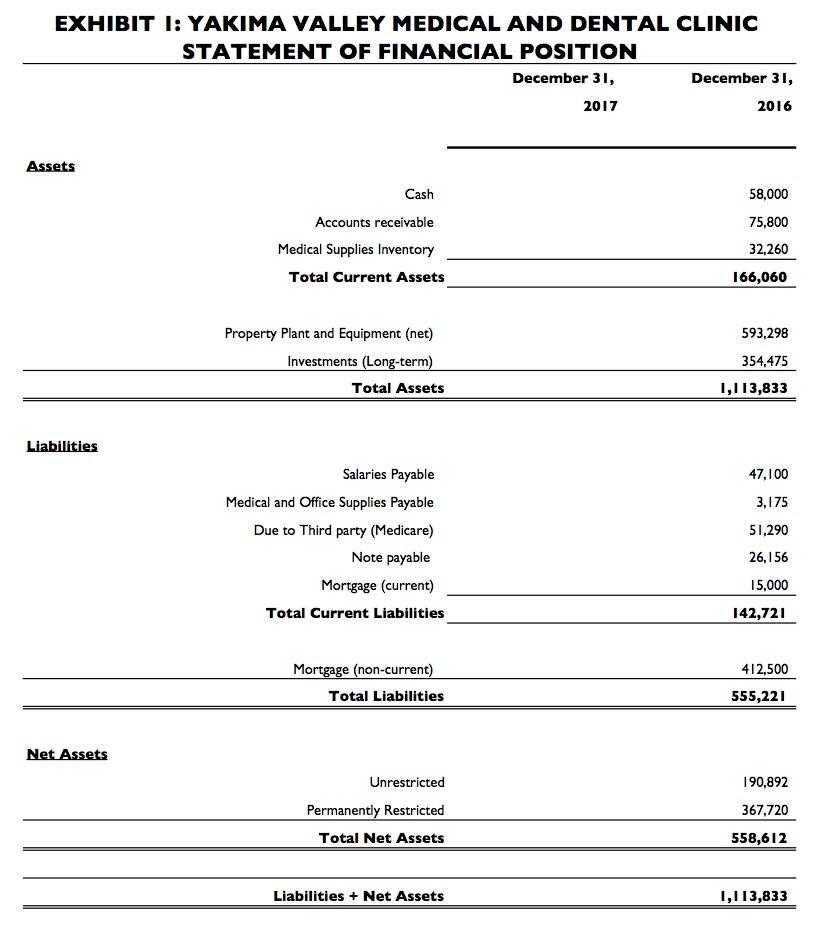
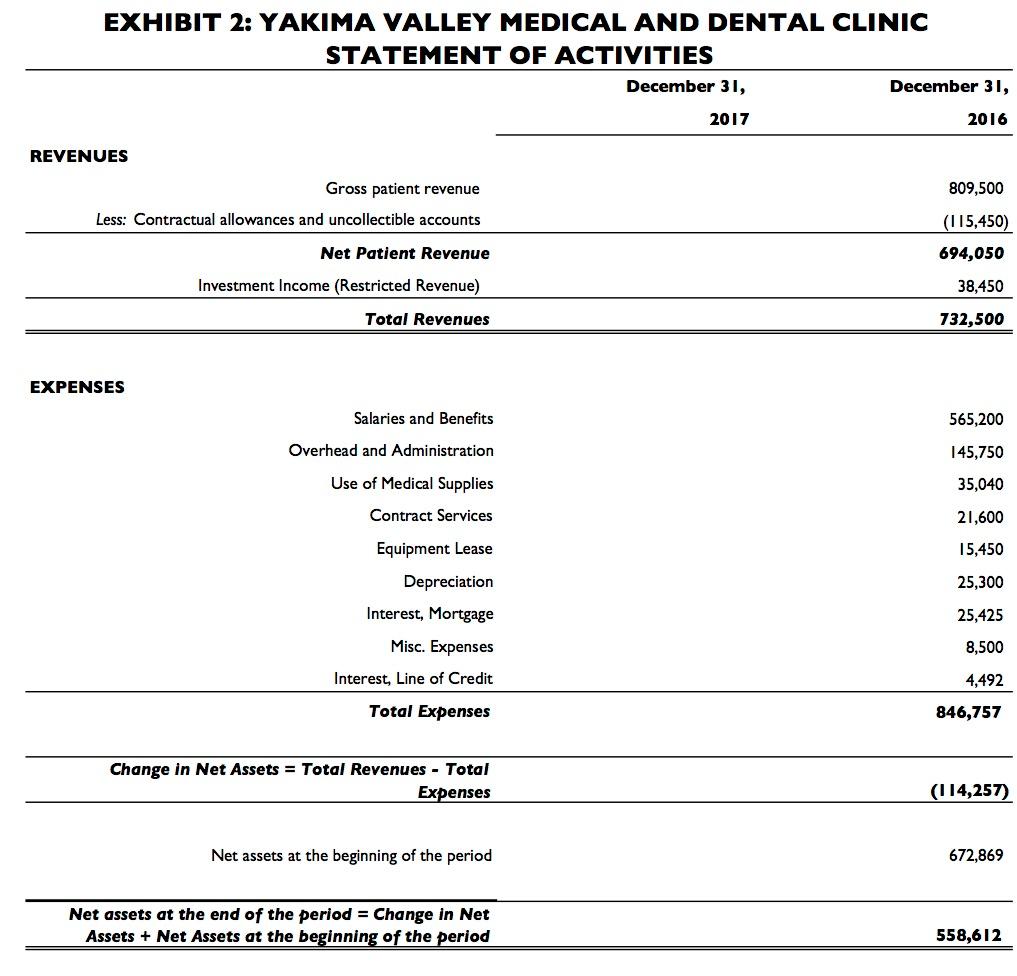
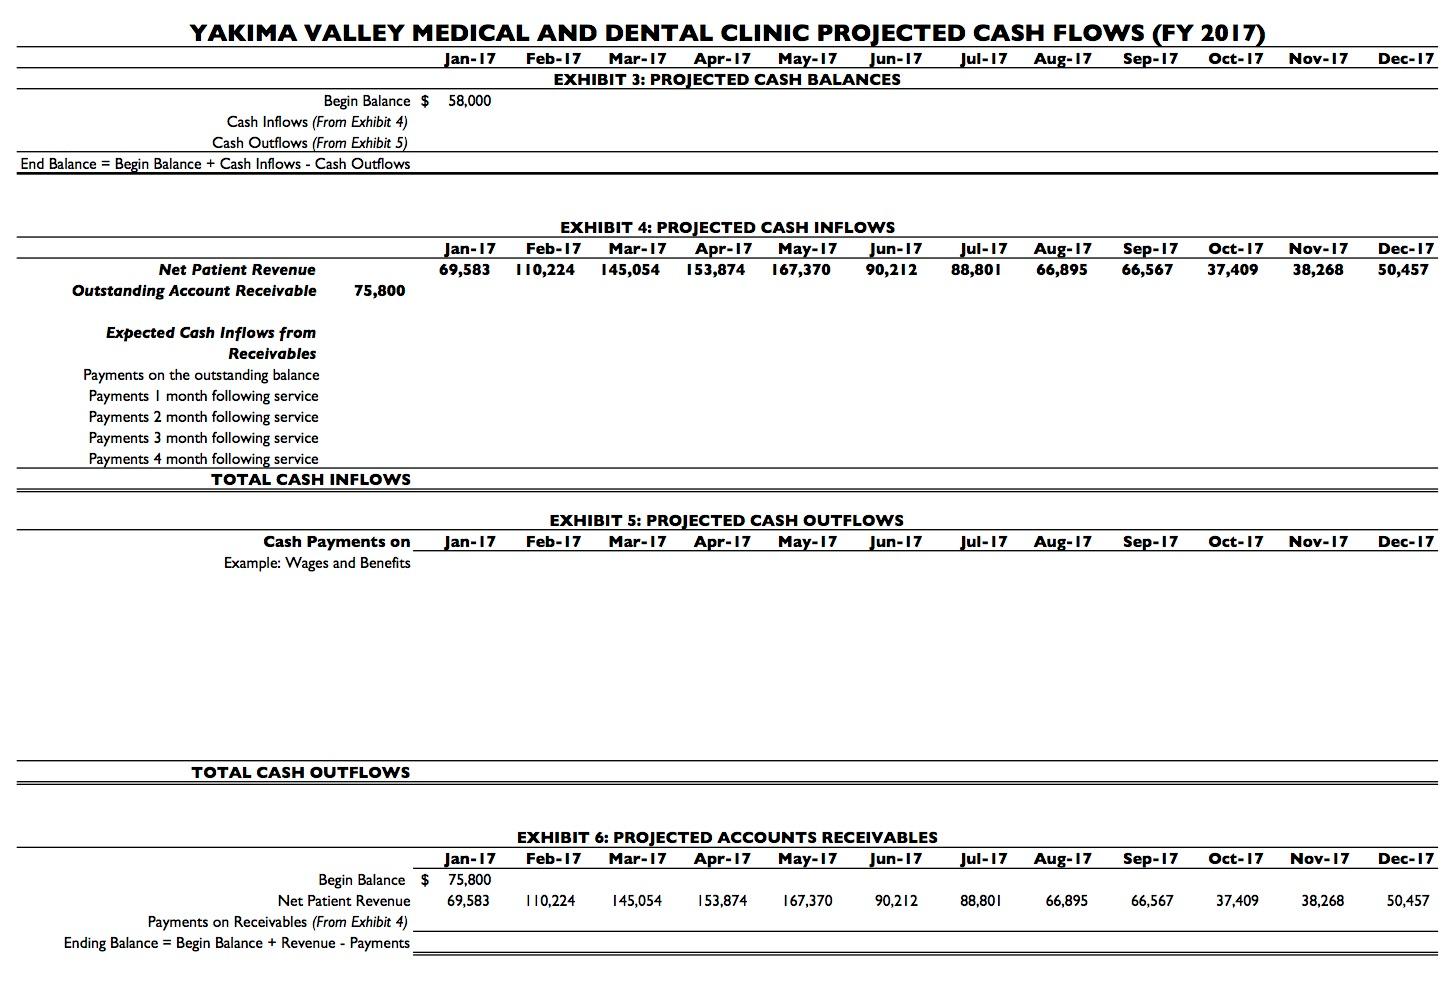
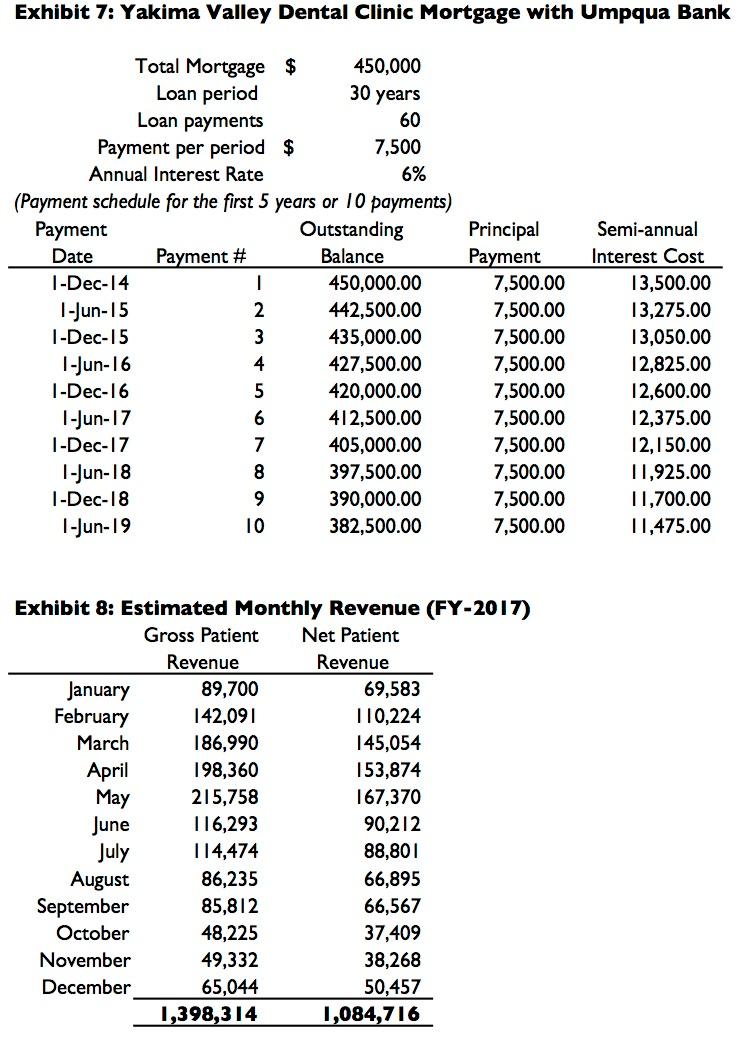
EXHIBIT I: YAKIMA VALLEY MEDICAL AND DENTAL CLINIC STATEMENT OF FINANCIAL POSITION December 31, December 31, 2017 2016 Assets Cash 58,000 75,800 Accounts receivable Medical Supplies Inventory Total Current Assets 32,260 166,060 593,298 Property Plant and Equipment (net) Investments (Long-term) Total Assets 354,475 1,113,833 Liabilities 47,100 3,175 51,290 Salaries Payable Medical and Office Supplies Payable Due to Third party (Medicare) Note payable Mortgage (current) Total Current Liabilities 26,156 15,000 142,721 412,500 Mortgage (non-current) Total Liabilities 555,221 Net Assets 190,892 Unrestricted Permanently Restricted Total Net Assets 367,720 558,612 Liabilities + Net Assets 1,113,833 EXHIBIT 2: YAKIMA VALLEY MEDICAL AND DENTAL CLINIC STATEMENT OF ACTIVITIES December 31, December 31, 2017 2016 REVENUES Gross patient revenue 809,500 Less: Contractual allowances and uncollectible accounts (115,450) 694,050 Net Patient Revenue Investment Income (Restricted Revenue) 38,450 Total Revenues 732,500 EXPENSES Salaries and Benefits 565,200 Overhead and Administration 145,750 Use of Medical Supplies Contract Services 35,040 21,600 15,450 Equipment Lease 25,300 Depreciation Interest, Mortgage Misc. Expenses 25,425 8,500 Interest, Line of Credit 4,492 Total Expenses 846,757 Change in Net Assets = Total Revenues - Total Expenses (114,257) Net assets at the beginning of the period 672,869 Net assets at the end of the period = Change in Net Assets + Net Assets at the beginning of the period 558,612 Nov-17 Dec-17 YAKIMA VALLEY MEDICAL AND DENTAL CLINIC PROJECTED CASH FLOWS (FY 2017) Jan-17 Feb-17 Mar-17 Apr-17 May-17 Jun-17 Jul-17 Aug-17 Sep-17 Oct-17 EXHIBIT 3: PROJECTED CASH BALANCES Begin Balance $ 58,000 Cash Inflows (From Exhibit 4) Cash Outflows (From Exhibit 5) End Balance = Begin Balance + Cash Inflows - Cash Outflows Jan-17 69,583 EXHIBIT 4: PROJECTED CASH INFLOWS Feb-17 Mar-17 Apr-17 May-17 Jun-17 110,224 145,054 153,874 167,370 90,212 Jul-17 88,801 Aug-17 Sep-17 66,567 Oct-17 37,409 Nov-17 38,268 Dec-17 50,457 66,895 Net Patient Revenue Outstanding Account Receivable 75,800 Expected Cash Inflows from Receivables Payments on the outstanding balance Payments 1 month following service Payments 2 month following service Payments 3 month following service Payments 4 month following service TOTAL CASH INFLOWS EXHIBIT 5: PROJECTED CASH OUTFLOWS Feb-17 Mar-17 Apr-17 May-17 Jun-17 Jan-17 Jul-17 Aug-17 Sep-17 Oct-17 Nov-17 Dec-17 Cash Payments on Example: Wages and Benefits TOTAL CASH OUTFLOWS EXHIBIT 6: PROJECTED ACCOUNTS RECEIVABLES Feb-17 Mar-17 Apr-17 May-17 Jun-17 Jul-17 Aug-17 Sep-17 Oct-17 Nov-17 Dec-17 Jan-17 75,800 69,583 110,224 145,054 153,874 167,370 90,212 88,801 66,895 66,567 37,409 38,268 50,457 Begin Balance Net Patient Revenue Payments on Receivables (From Exhibit 4) Ending Balance = Begin Balance + Revenue - Payments Exhibit 7: Yakima Valley Dental Clinic Mortgage with Umpqua Bank 30 years Total Mortgage $ 450,000 Loan period Loan payments 60 Payment per period $ 7,500 Annual Interest Rate 6% (Payment schedule for the first 5 years or 10 payments) Payment Outstanding Date Payment # Balance 1-Dec-14 . 450,000.00 1-Jun-15 2 442,500.00 1-Dec-15 3 435,000.00 1-Jun-16 4 427,500.00 1-Dec-16 5 420,000.00 1-Jun-17 6 412,500.00 1-Dec-17 7 405,000.00 1-Jun-18 8 397,500.00 1-Dec-18 9 390,000.00 1-Jun-19 10 382,500.00 Principal Payment 7,500.00 7,500.00 7,500.00 7,500.00 7,500.00 7,500.00 7,500.00 7,500.00 7,500.00 7,500.00 Semi-annual Interest Cost 13,500.00 13,275.00 13,050.00 12,825.00 12,600.00 12,375.00 12,150.00 11,925.00 11,700.00 11,475.00 Exhibit 8: Estimated Monthly Revenue (FY-2017) Gross Patient Net Patient Revenue Revenue January 89,700 69,583 February 142,091 110,224 March 186,990 145,054 April 198,360 153,874 May 215,758 167,370 June 116,293 90,212 July 114,474 88,801 August 86,235 66,895 September 85,812 66,567 October 48,225 37,409 November 49,332 38,268 December 65,044 50,457 1,398,314 1,084,716 EXHIBIT I: YAKIMA VALLEY MEDICAL AND DENTAL CLINIC STATEMENT OF FINANCIAL POSITION December 31, December 31, 2017 2016 Assets Cash 58,000 75,800 Accounts receivable Medical Supplies Inventory Total Current Assets 32,260 166,060 593,298 Property Plant and Equipment (net) Investments (Long-term) Total Assets 354,475 1,113,833 Liabilities 47,100 3,175 51,290 Salaries Payable Medical and Office Supplies Payable Due to Third party (Medicare) Note payable Mortgage (current) Total Current Liabilities 26,156 15,000 142,721 412,500 Mortgage (non-current) Total Liabilities 555,221 Net Assets 190,892 Unrestricted Permanently Restricted Total Net Assets 367,720 558,612 Liabilities + Net Assets 1,113,833 EXHIBIT 2: YAKIMA VALLEY MEDICAL AND DENTAL CLINIC STATEMENT OF ACTIVITIES December 31, December 31, 2017 2016 REVENUES Gross patient revenue 809,500 Less: Contractual allowances and uncollectible accounts (115,450) 694,050 Net Patient Revenue Investment Income (Restricted Revenue) 38,450 Total Revenues 732,500 EXPENSES Salaries and Benefits 565,200 Overhead and Administration 145,750 Use of Medical Supplies Contract Services 35,040 21,600 15,450 Equipment Lease 25,300 Depreciation Interest, Mortgage Misc. Expenses 25,425 8,500 Interest, Line of Credit 4,492 Total Expenses 846,757 Change in Net Assets = Total Revenues - Total Expenses (114,257) Net assets at the beginning of the period 672,869 Net assets at the end of the period = Change in Net Assets + Net Assets at the beginning of the period 558,612 Nov-17 Dec-17 YAKIMA VALLEY MEDICAL AND DENTAL CLINIC PROJECTED CASH FLOWS (FY 2017) Jan-17 Feb-17 Mar-17 Apr-17 May-17 Jun-17 Jul-17 Aug-17 Sep-17 Oct-17 EXHIBIT 3: PROJECTED CASH BALANCES Begin Balance $ 58,000 Cash Inflows (From Exhibit 4) Cash Outflows (From Exhibit 5) End Balance = Begin Balance + Cash Inflows - Cash Outflows Jan-17 69,583 EXHIBIT 4: PROJECTED CASH INFLOWS Feb-17 Mar-17 Apr-17 May-17 Jun-17 110,224 145,054 153,874 167,370 90,212 Jul-17 88,801 Aug-17 Sep-17 66,567 Oct-17 37,409 Nov-17 38,268 Dec-17 50,457 66,895 Net Patient Revenue Outstanding Account Receivable 75,800 Expected Cash Inflows from Receivables Payments on the outstanding balance Payments 1 month following service Payments 2 month following service Payments 3 month following service Payments 4 month following service TOTAL CASH INFLOWS EXHIBIT 5: PROJECTED CASH OUTFLOWS Feb-17 Mar-17 Apr-17 May-17 Jun-17 Jan-17 Jul-17 Aug-17 Sep-17 Oct-17 Nov-17 Dec-17 Cash Payments on Example: Wages and Benefits TOTAL CASH OUTFLOWS EXHIBIT 6: PROJECTED ACCOUNTS RECEIVABLES Feb-17 Mar-17 Apr-17 May-17 Jun-17 Jul-17 Aug-17 Sep-17 Oct-17 Nov-17 Dec-17 Jan-17 75,800 69,583 110,224 145,054 153,874 167,370 90,212 88,801 66,895 66,567 37,409 38,268 50,457 Begin Balance Net Patient Revenue Payments on Receivables (From Exhibit 4) Ending Balance = Begin Balance + Revenue - Payments Exhibit 7: Yakima Valley Dental Clinic Mortgage with Umpqua Bank 30 years Total Mortgage $ 450,000 Loan period Loan payments 60 Payment per period $ 7,500 Annual Interest Rate 6% (Payment schedule for the first 5 years or 10 payments) Payment Outstanding Date Payment # Balance 1-Dec-14 . 450,000.00 1-Jun-15 2 442,500.00 1-Dec-15 3 435,000.00 1-Jun-16 4 427,500.00 1-Dec-16 5 420,000.00 1-Jun-17 6 412,500.00 1-Dec-17 7 405,000.00 1-Jun-18 8 397,500.00 1-Dec-18 9 390,000.00 1-Jun-19 10 382,500.00 Principal Payment 7,500.00 7,500.00 7,500.00 7,500.00 7,500.00 7,500.00 7,500.00 7,500.00 7,500.00 7,500.00 Semi-annual Interest Cost 13,500.00 13,275.00 13,050.00 12,825.00 12,600.00 12,375.00 12,150.00 11,925.00 11,700.00 11,475.00 Exhibit 8: Estimated Monthly Revenue (FY-2017) Gross Patient Net Patient Revenue Revenue January 89,700 69,583 February 142,091 110,224 March 186,990 145,054 April 198,360 153,874 May 215,758 167,370 June 116,293 90,212 July 114,474 88,801 August 86,235 66,895 September 85,812 66,567 October 48,225 37,409 November 49,332 38,268 December 65,044 50,457 1,398,314 1,084,716


