

Answered step by step
Verified Expert Solution
Question
1 Approved Answer
You have collected data over the summer on the hours of exposure to sunlight received by 100 tomato plants and the number of tomatoes that
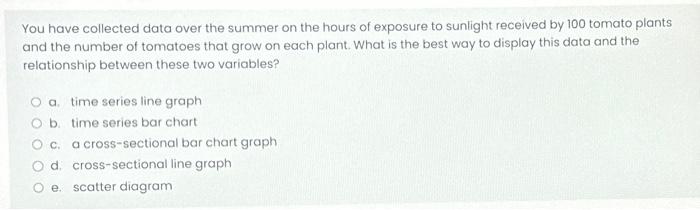
You have collected data over the summer on the hours of exposure to sunlight received by 100 tomato plants and the number of tomatoes that grow on each plant. What is the best way to display this data and the relationship between these two variables? O a. time series line graph O b. time series bar chart a cross-sectional bar chart graph C. O d. cross-sectional line graph O e. scatter diagram
Step by Step Solution
There are 3 Steps involved in it
Step: 1

Get Instant Access to Expert-Tailored Solutions
See step-by-step solutions with expert insights and AI powered tools for academic success
Step: 2

Step: 3
Ace Your Homework with AI
Get the answers you need in no time with our AI-driven, step-by-step assistance
Get Started
University Finances Accounting And Budgeting Principles For Higher Education
Authors: Dean O. Smith
1st Edition
1421427257, 978-1421427256