

Answered step by step
Verified Expert Solution
Question
1 Approved Answer
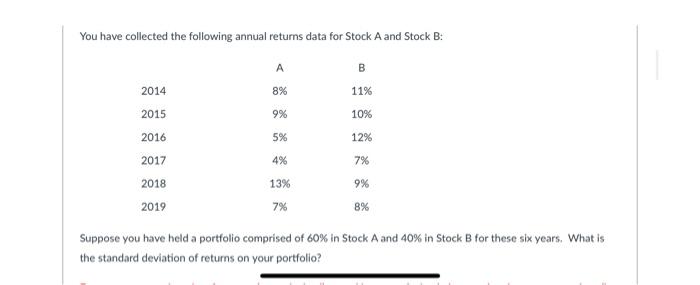
You have collected the following annual returns data for Stock A and Stock B: B 11% 8% 9% 10% 5% 12% 2014 2015 2016 2017
Step by Step Solution
There are 3 Steps involved in it
Step: 1

Get Instant Access to Expert-Tailored Solutions
See step-by-step solutions with expert insights and AI powered tools for academic success
Step: 2

Step: 3
Ace Your Homework with AI
Get the answers you need in no time with our AI-driven, step-by-step assistance
Get Started
Finance Led Capitalism Shadow Banking Re Regulation And The Future Of Global Markets
Authors: Robert Guttmann
1st Edition
1137398566, 978-1137398567