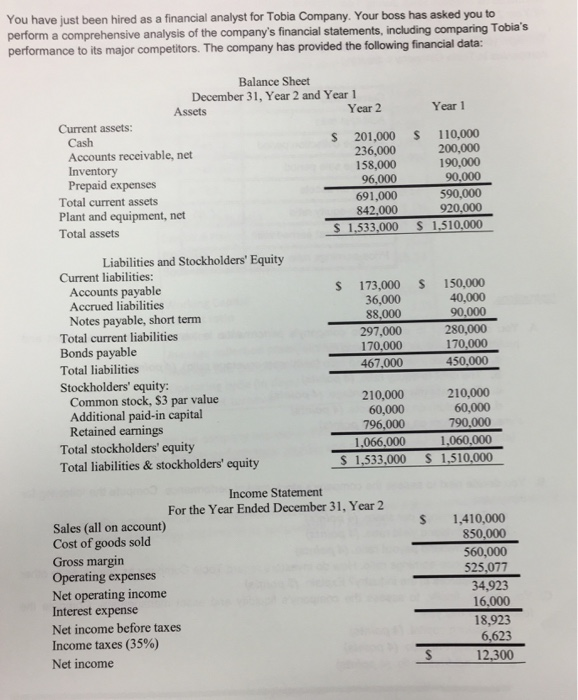
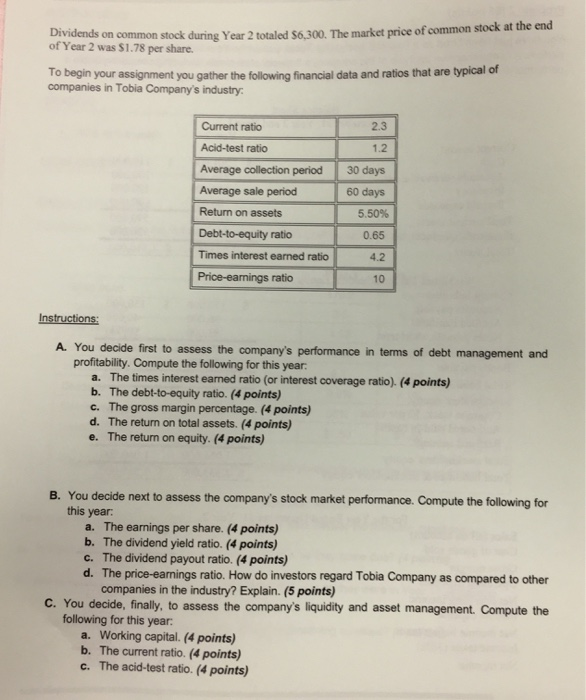
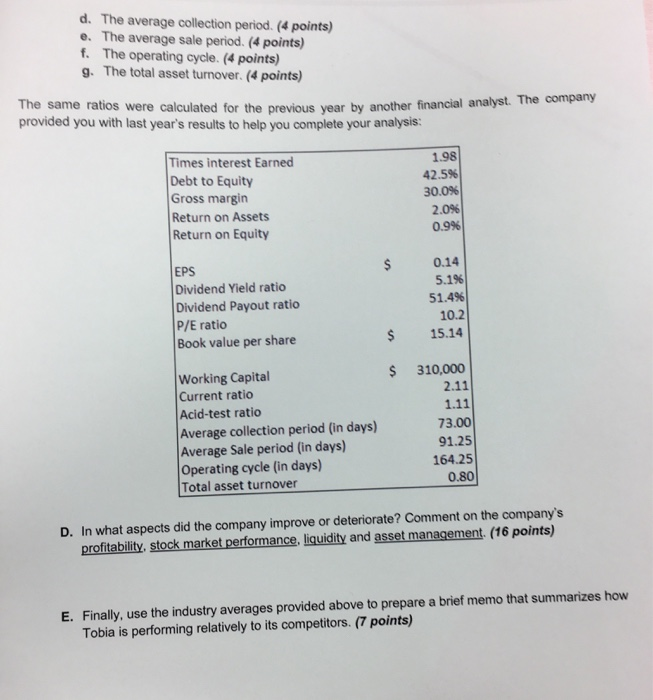
You have just been hired as a financial analyst for Tobia Company. Your boss has asked you to perform a comprehensive analysis of the company's financial statements, including comparing Tobia's performance to its major competitors. The company has provided the following financial data: Balance Sheet December 31, Year 2 and Year 1 Assets Year 2 Year 1 Current assets: Cash Accounts receivable, net Inventory Prepaid expenses $ 10,000 200,000 190,000 $ 201,000 236,000 158,000 96,000 90,000 590,000 920,000 S 1,510,000 Total current assets 691,000 842,000 $ 1,533,000 Plant and equipment, net Total assets Liabilities and Stockholders' Equity Current liabilities: Accounts payable Accrued liabilities Notes payable, short term 150,000 40,000 90,000 280,000 170,000 173,000 36,000 88,000 297,000 170,000 Total current liabilities Bonds payable 450,000 Total liabilities 467,000 Stockholders' equity: Common stock, $3 par value Additional paid-in capital Retained earnings Total stockholders' equity Total liabilities & stockholders' equity 210,000 60,000 790,000 210,000 60,000 796,000 1,060,000 $ 1,510,000 1,066,000 $ 1,533,000 Income Statement For the Year Ended December 31, Year 2 1,410,000 850,000 560,000 525,077 Sales (all on account) Cost of goods sold Gross margin Operating expenses Net operating income Interest expense 34,923 16,000 18,923 6,623 12,300 Net income before taxes Income taxes (35%) Net income Dividends on common stock during Year 2 totaled $6,300. The market price of common stock at the end of Year 2 was $1.78 per share. To begin your assignment you gather the following financial data and ratios that are typical of companies in Tobia Company's industry: 2.3 Current ratio 1.2 Acid-test ratio 30 days Average collection period 60 days Average sale period 5.50% Return on assets 0.65 Debt-to-equity ratio Times interest earned ratio 4.2 Price-earnings ratio 10 Instructions: A. You decide first to assess the company's performance in terms of debt management and profitability. Compute the following for this year: a. The times interest earned ratio (or interest coverage ratio). (4 points) b. The debt-to-equity ratio. (4 points) c. The gross margin percentage. (4 points) d. The return on total assets. (4 points) e. The return on equity. (4 points) B. You decide next to assess the company's stock market performance. Compute the following for this year: a. The earnings per share. (4 points) b. The dividend yield ratio. (4 points) c. The dividend payout ratio. (4 points) d. The price-earnings ratio. How do investors regard Tobia Company as compared to other companies in the industry? Explain. (5 points) C. You decide, finally, to assess the company's liquidity and asset management. Compute the following for this year: a. Working capital. (4 points) b. The current ratio. (4 points) c. The acid-test ratio. (4 points) d. The average collection period. (4 points) e. The average sale period. (4 points) f. The operating cycle. (4 points) g. The total asset turnover. (4 points) The same ratios were calculated for the previous year by another financial analyst. The company provided you with last year's results to help you complete your analysis: Times interest Earned Debt to Equity Gross margin Return on Assets Return on Equity 1.98 42.5% 30.0% 2.0% 0.9% EPS Dividend Yield ratio Dividend Payout ratio P/E ratio Book value per share 0.14 5.1% 51.4% 10.2 2$ 15.14 310,000 Working Capital Current ratio Acid-test ratio Average collection period (in days) Average Sale period (in days) Operating cycle (in days) Total asset turnover 2.11 1.11 73.00 91.25 164.25 0.80 D. In what aspects did the company improve or deteriorate? Comment on the company's profitability, stock market performance, liquidity and asset management. (16 points) E. Finally, use the industry averages provided above to prepare a brief memo that summarizes how Tobia is performing relatively to its competitors. (7 points)


